

Question: Explain what you found out after visualization (Max 1 paragraph).no handwritten please Data Analytics Show Trend Lines. 7 Explain what you found out after visualization
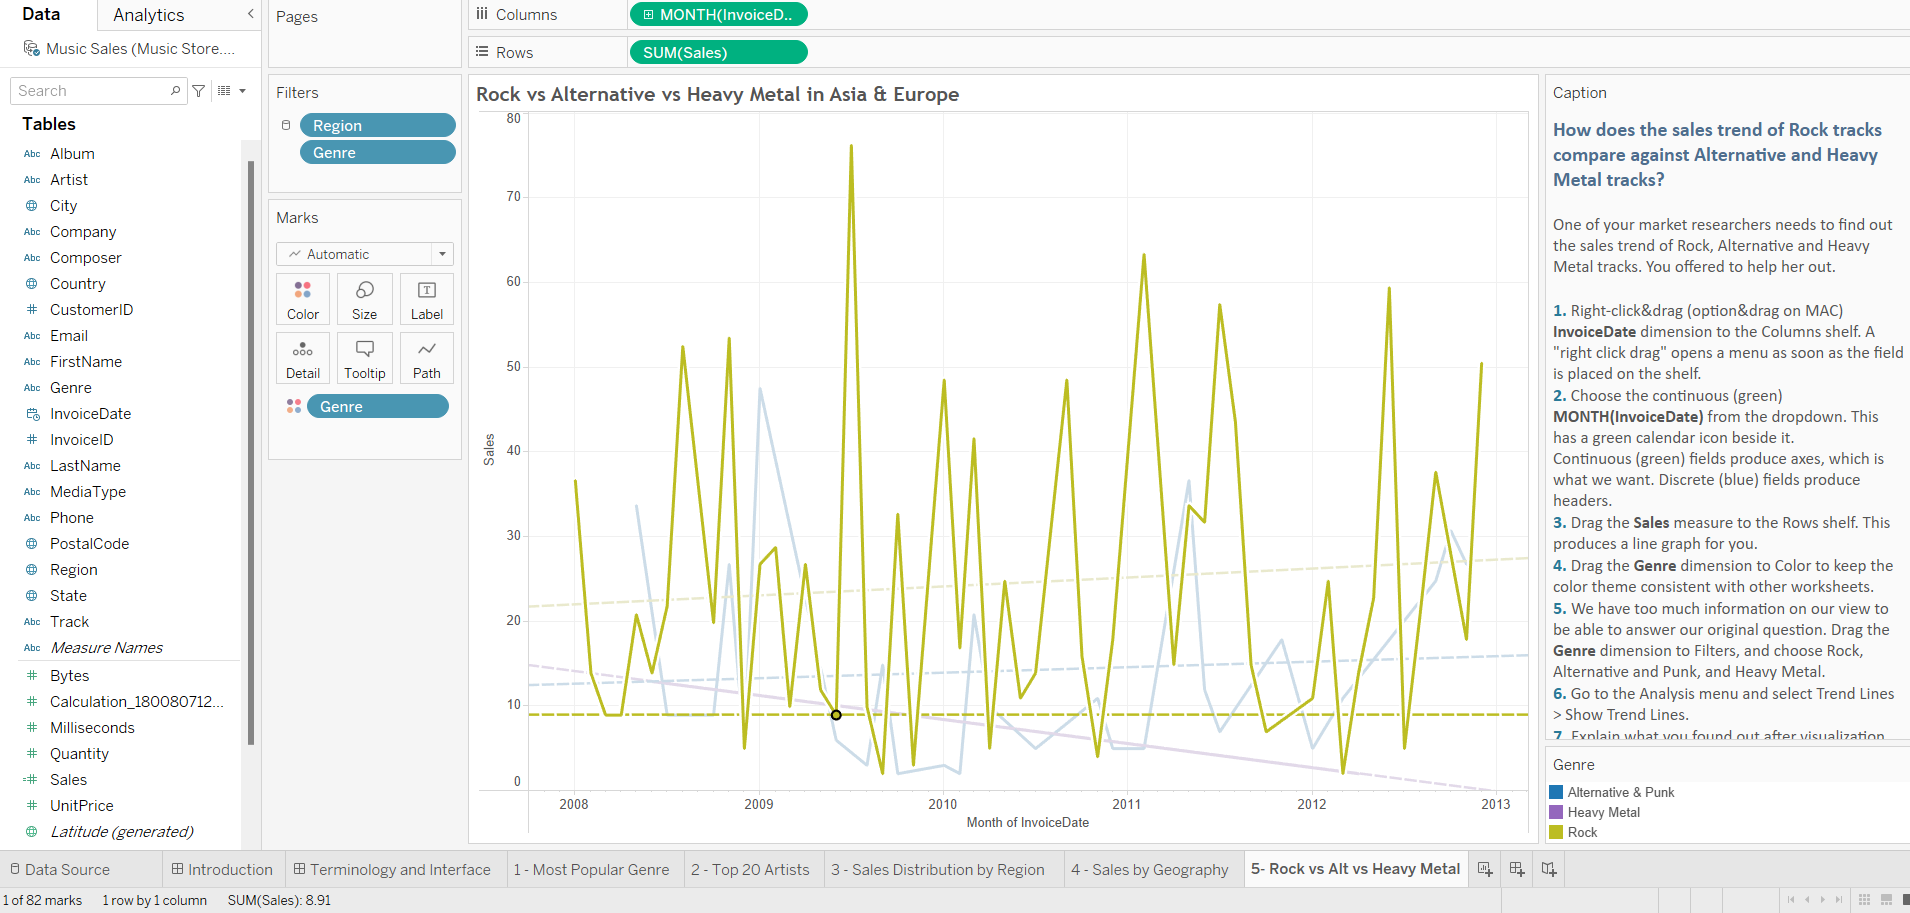 Explain what you found out after visualization (Max 1 paragraph).no handwritten please
Step by Step Solution
There are 3 Steps involved in it
1 Expert Approved Answer
Step: 1 Unlock

Question Has Been Solved by an Expert!
Get step-by-step solutions from verified subject matter experts
Step: 2 Unlock
Step: 3 Unlock