

Question: Explain whether or not these variables from RStudio are normally distributed, are distribution symmetrical or skewed. Explain your findings Shapiro-Wilk normality test data: claim_amount W
Explain whether or not these variables from RStudio are normally distributed, are distribution symmetrical or skewed. Explain your findings 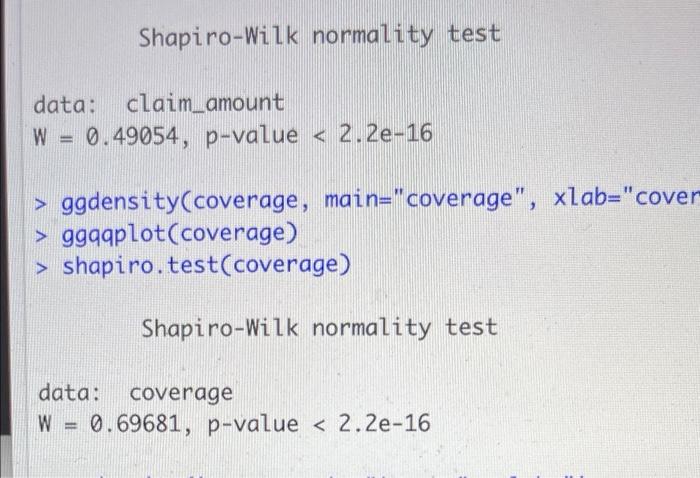
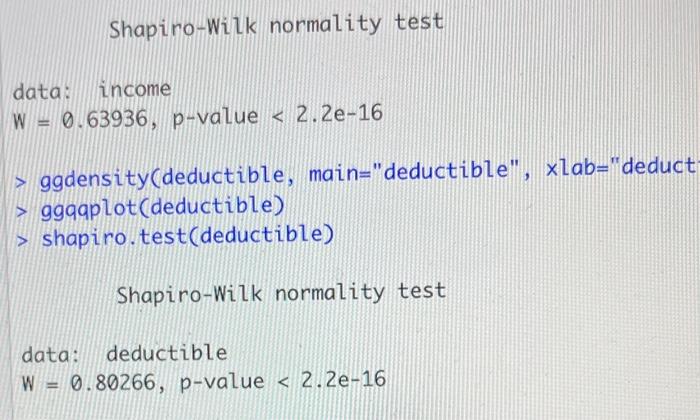
Shapiro-Wilk normality test data: claim_amount W = 0.49054, p-value ggdensity(coverage, main="coverage", xlab="cover > ggqqplot(coverage) > shapiro.test(coverage) Shapiro-Wilk normality test data: coverage W = 0.69681, p-value shapiro.test(deductible) Shapiro-Wilk normality test data: deductible W = 0.80266, p-value
Step by Step Solution
There are 3 Steps involved in it
1 Expert Approved Answer
Step: 1 Unlock

Question Has Been Solved by an Expert!
Get step-by-step solutions from verified subject matter experts
Step: 2 Unlock
Step: 3 Unlock