

Question: Explain why the supply curve changed as compared to the previous graph 4. A shortage of grain has caused a change in the bakery's supply
Explain why the supply curve changed as compared to the previous graph
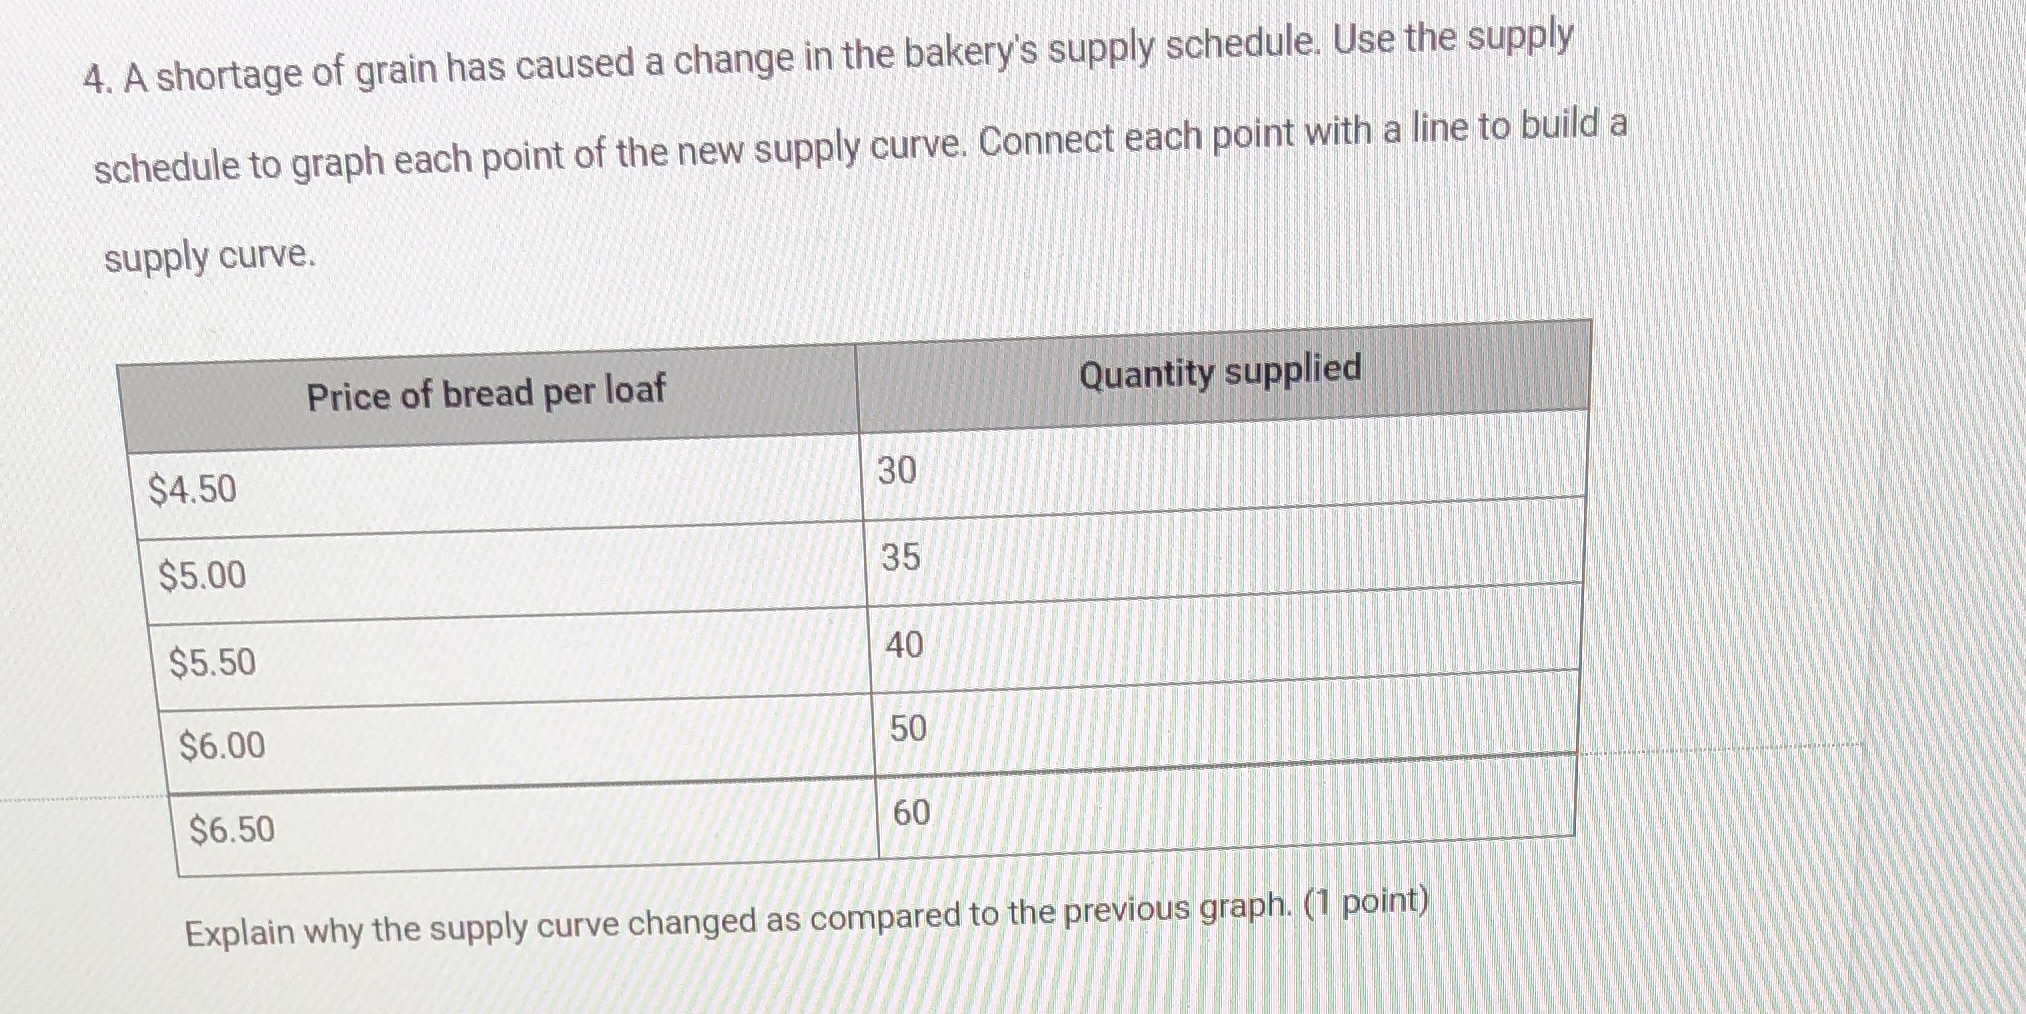
4. A shortage of grain has caused a change in the bakery's supply schedule. Use the supply schedule to graph each point of the new supply curve. Connect each point with a line to build a supply curve. Price of bread per loaf Quantity supplied $4.50 30 $5.00 35 $5.50 40 $6.00 50 $6.50 60 Explain why the supply curve changed as compared to the previous graph. (1 point)
Step by Step Solution
There are 3 Steps involved in it
1 Expert Approved Answer
Step: 1 Unlock

Question Has Been Solved by an Expert!
Get step-by-step solutions from verified subject matter experts
Step: 2 Unlock
Step: 3 Unlock