

Question: Explain why welfare effect estimates like what was calculated in part a) are most likely underestimating the true welfare effects of trade instruments 5. The
Explain why welfare effect estimates like what was calculated in part a) are most likely underestimating the true welfare effects of trade instruments
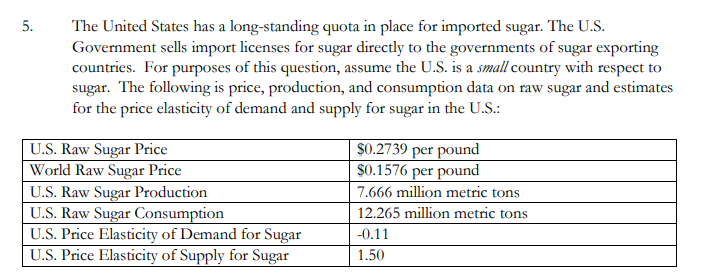
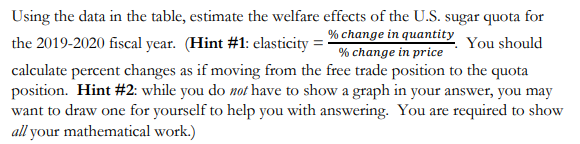
5. The United States has a long-standing quota in place for imported sugar. The U.S. Government sells import licenses for sugar directly to the governments of sugar exporting countries. For purposes of this question, assume the U.S. is a small country with respect to sugar. The following is price, production, and consumption data on raw sugar and estimates for the price elasticity of demand and supply for sugar in the U.S.: U.S. Raw Sugar Price World Raw Sugar Price U.S. Raw Sugar Production U.S. Raw Sugar Consumption U.S. Price Elasticity of Demand for Sugar U.S. Price Elasticity of Supply for Sugar $0.2739 per pound $0.1576 per pound 7.666 million metric tons 12.265 million metric tons -0.11 1.50 Using the data in the table, estimate the welfare effects of the U.S. sugar quota for the 2019-2020 fiscal year. (Hint #1: elasticity = % change in quantity You should % change in price calculate percent changes as if moving from the free trade position to the quota position. Hint #2: while you do not have to show a graph in your answer, you may want to draw one for yourself to help you with answering. You are required to show all your mathematical work.) 5. The United States has a long-standing quota in place for imported sugar. The U.S. Government sells import licenses for sugar directly to the governments of sugar exporting countries. For purposes of this question, assume the U.S. is a small country with respect to sugar. The following is price, production, and consumption data on raw sugar and estimates for the price elasticity of demand and supply for sugar in the U.S.: U.S. Raw Sugar Price World Raw Sugar Price U.S. Raw Sugar Production U.S. Raw Sugar Consumption U.S. Price Elasticity of Demand for Sugar U.S. Price Elasticity of Supply for Sugar $0.2739 per pound $0.1576 per pound 7.666 million metric tons 12.265 million metric tons -0.11 1.50 Using the data in the table, estimate the welfare effects of the U.S. sugar quota for the 2019-2020 fiscal year. (Hint #1: elasticity = % change in quantity You should % change in price calculate percent changes as if moving from the free trade position to the quota position. Hint #2: while you do not have to show a graph in your answer, you may want to draw one for yourself to help you with answering. You are required to show all your mathematical work.)
Step by Step Solution
There are 3 Steps involved in it

Get step-by-step solutions from verified subject matter experts