

Question: explain why your data follows (or does not follow) a Weibull distribution. Probability Plot of %Sand Weibull - 95% CI begin{tabular}{|lr|} hline Shape & 1.426
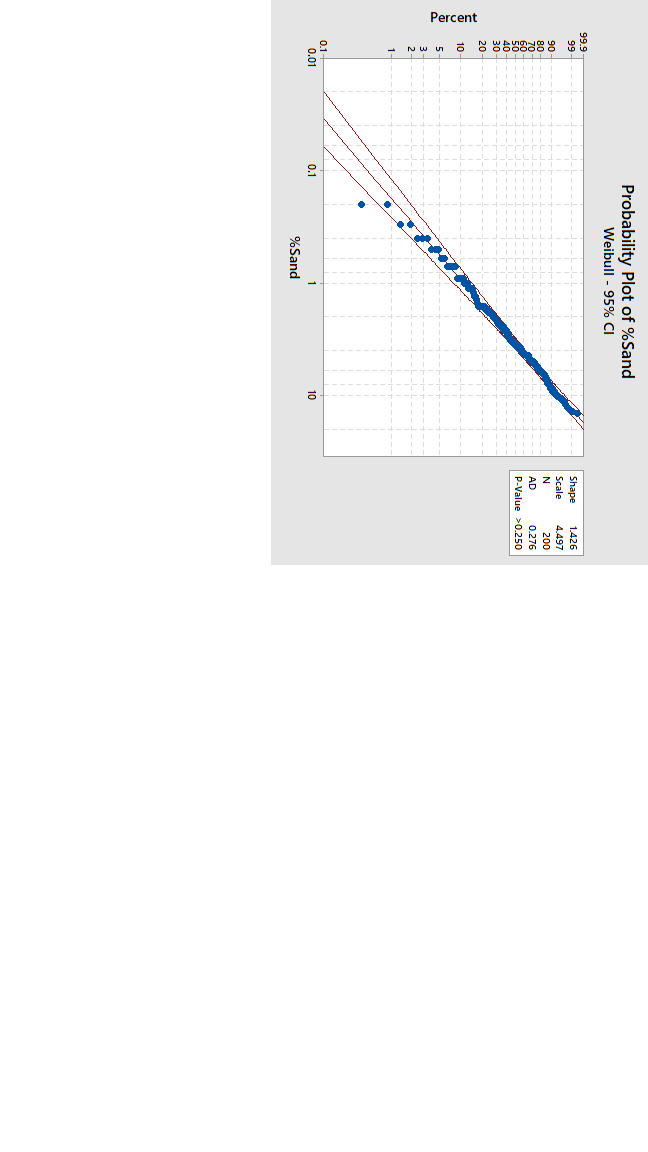
explain why your data follows (or does not follow) a Weibull distribution.
Probability Plot of \%Sand Weibull - 95\% CI \begin{tabular}{|lr|} \hline Shape & 1.426 \\ Scale & 4.497 \\ N & 200 \\ AD & 0.276 \\ P-Value & >0.250 \\ \hline \end{tabular}Step by Step Solution
There are 3 Steps involved in it
1 Expert Approved Answer
Step: 1 Unlock

Question Has Been Solved by an Expert!
Get step-by-step solutions from verified subject matter experts
Step: 2 Unlock
Step: 3 Unlock