

Question: Explain with each step and excel part 12. Collect data of the 2010 income for the OECD countries. Complete the following table with formulas and
Explain with each step and excel part
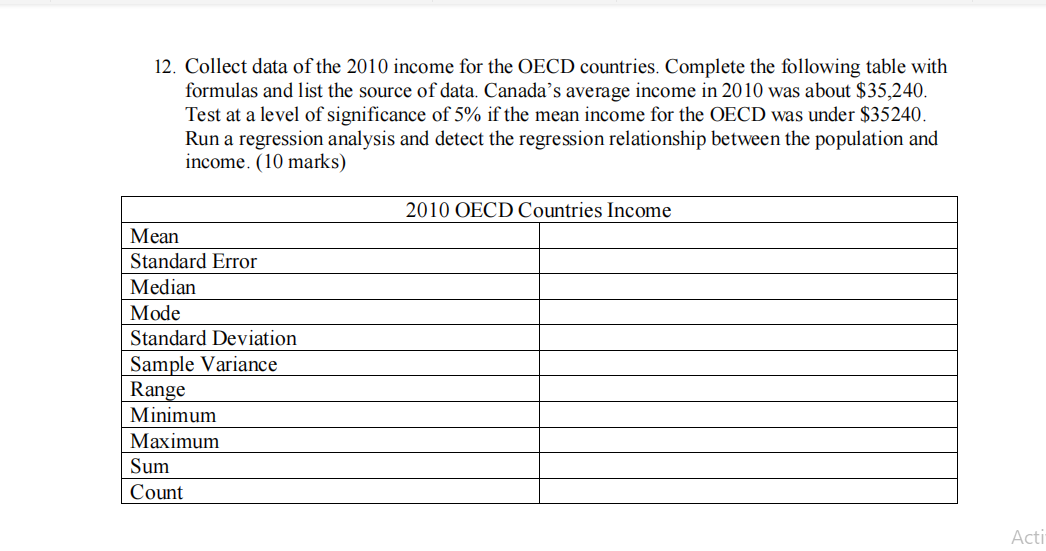
12. Collect data of the 2010 income for the OECD countries. Complete the following table with formulas and list the source of data. Canada's average income in 2010 was about $35,240. Test at a level of signicance of 5% if the mean income for the OECD was under $35240. Run a regression analysis and detect the regression relationship between the population and income. {10 marks) Mean 2010 OECD Countries Income Standard Error Median Mode Standard Deviation Sample Variance Range Minimum Maximum Sum Count
Step by Step Solution
There are 3 Steps involved in it
1 Expert Approved Answer
Step: 1 Unlock

Question Has Been Solved by an Expert!
Get step-by-step solutions from verified subject matter experts
Step: 2 Unlock
Step: 3 Unlock