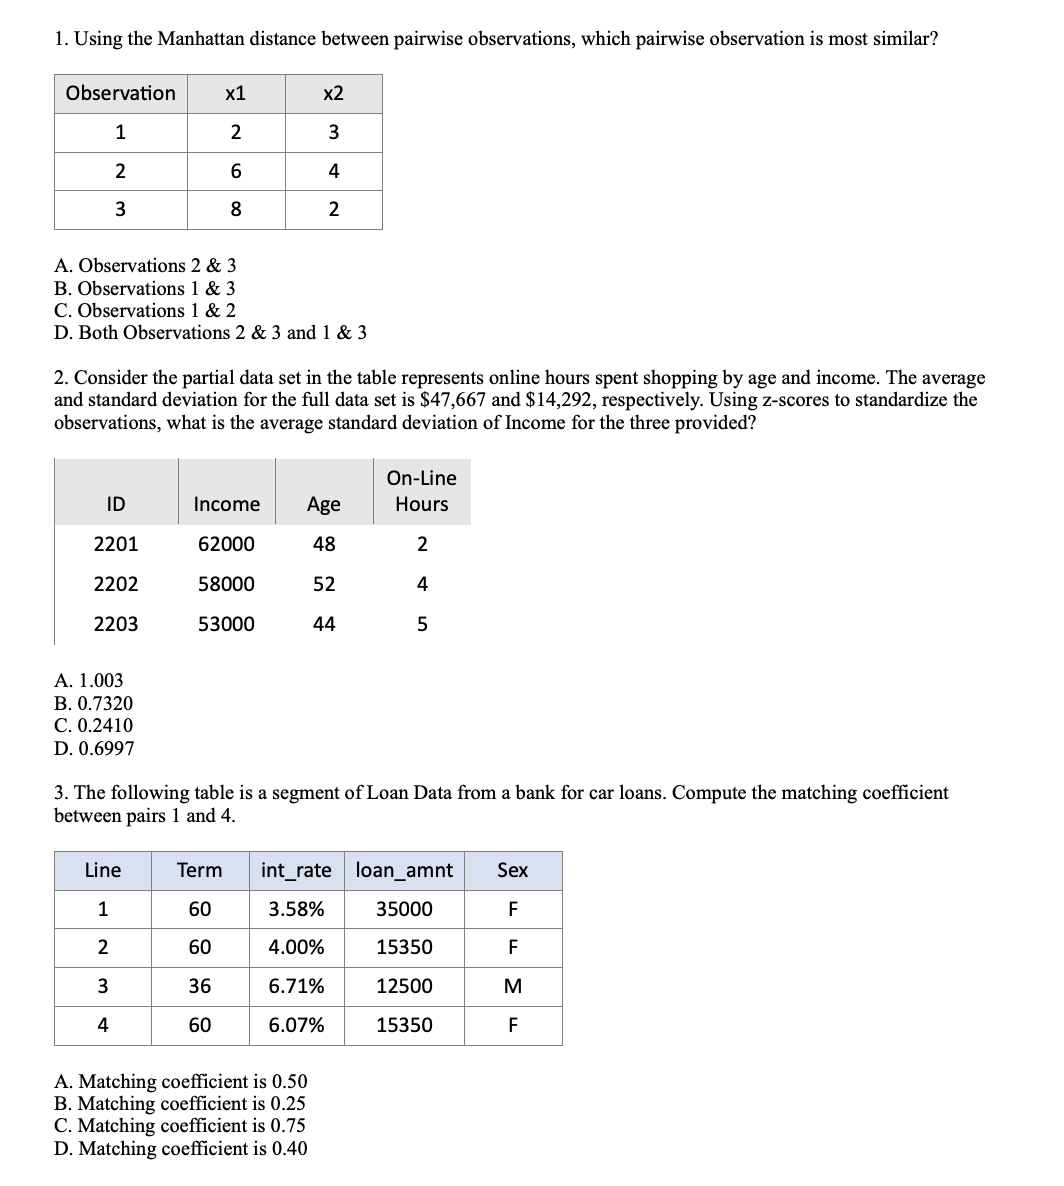
Question: explanation for each answer. 1. Using the Manhattan distance between pairwise observations, which pairwise observation is most similar? Observation X] X2 1 2 3 2

explanation for each answer.

explanation for each answer. 1. Using theexplanation for each answer. 1. Using theexplanation for each answer. 1. Using the
1. Using the Manhattan distance between pairwise observations, which pairwise observation is most similar? Observation X] X2 1 2 3 2 6 4 3 8 2 A. Observations 2 & 3 B. Observations 1 & 3 C. Observations 1 & 2 D. Both Observations 2 & 3 and 1 & 3 2. Consider the partial data set in the table represents online hours spent shopping by age and income. The average and standard deviation for the full data set is $47,667 and $14,292, respectively. Using z-scores to standardize the observations, what is the average standard deviation of Income for the three provided? On-Line ID Income Age Hours 2201 62000 48 2 2202 58000 52 A 2203 53000 44 UT A. 1.003 B. 0.7320 C. 0.2410 D. 0.6997 3. The following table is a segment of Loan Data from a bank for car loans. Compute the matching coefficient between pairs 1 and 4. Line Term int_rate loan_amnt Sex 1 60 3.58% 35000 F 2 60 4.00% 15350 F 3 36 6.71% 12500 M 60 6.07% 15350 E A. Matching coefficient is 0.50 B. Matching coefficient is 0.25 C. Matching coefficient is 0.75 D. Matching coefficient is 0.404. Sandra began collecting transaction details to see if the same items were in each sales transaction. Compute the matching coefficient and Jaccard's coefficient for pairwise transaction 1 & 2. Transaction Coffee Tea Scone Muffin Cookie 1 Yes No Yes No Yes 2 Yes Yes Yes No No A. Matching Coefficient = 0.60 and Jaccard's = 0.40 B. Matching Coefficient = 0.40 and Jaccard's = 0.50 C. Matching Coefficient = 0.60 and Jaccard's = 0.50 D. Matching Coefficient = 0.40 and Jaccard's = 0.40 5. Based on the following confusion matrix with a validation set of 100, class 1 reflects the members targeted who purchased services and class 0 reflects the non-targeted respondents who did not purchase services. Calculate the specificity rate. Actual Class Predicted Class 1 Predicted Class 0 Class 1 18 11 Class 0 11 60 A. 62% B. 78% C. 84% D. 84.5% 6. Based on the following confusion matrix with a validation set of 100, class 1 reflects the members targeted who purchased services and class 0 reflects the non-targeted respondents who did not purchase services. Calculate the sensitivity rate. Actual Class Predicted Class 1 Predicted Class 2 Class 1 18 11 Class 0 11 60 A. 78% B. 84% C. 62% D. 32%7. The root mean square error calculation is: Eel n 8. The following table displays the weights for computing the principal components and the data for two observations. The mean and standard deviation for x1 are 4.2 and 1.4, respectively. What is the z-score of x1 for observation 1? Observation 1 Observation 2 A. 0.18 B. 0.17 C. 0.73 D. 0.21

Step by Step Solution

There are 3 Steps involved in it

1 Expert Approved Answer
Step: 1 Unlock blur-text-image
Question Has Been Solved by an Expert!

Get step-by-step solutions from verified subject matter experts

Step: 2 Unlock
Step: 3 Unlock

Students Have Also Explored These Related General Management Questions!