

Question: explanation most needed please thankyou 9. Prot can be found by subtracting costs from revenue. During which period did the company make the greatest prot?
explanation most needed please thankyou
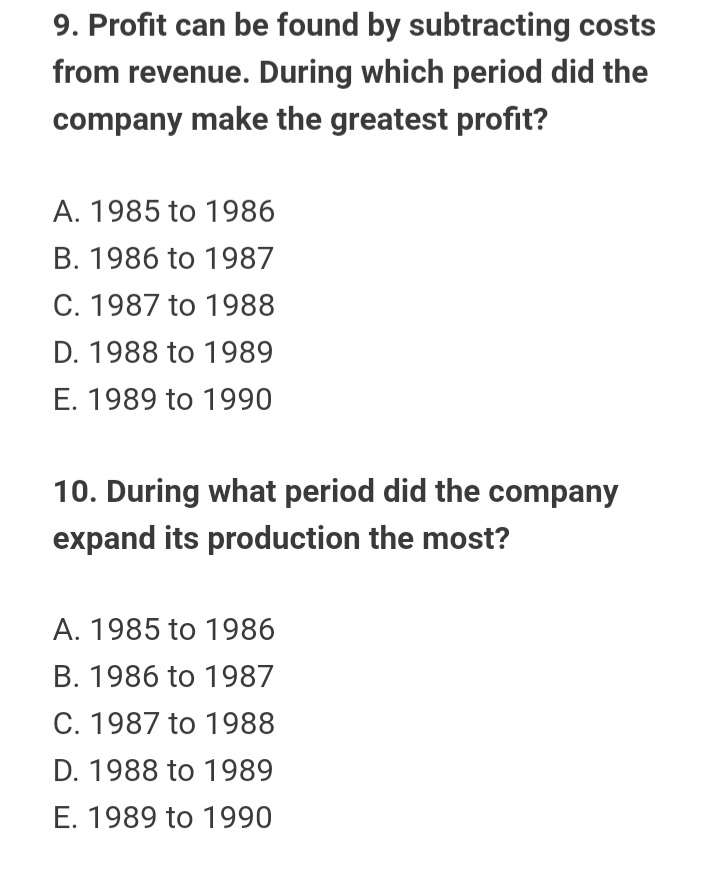

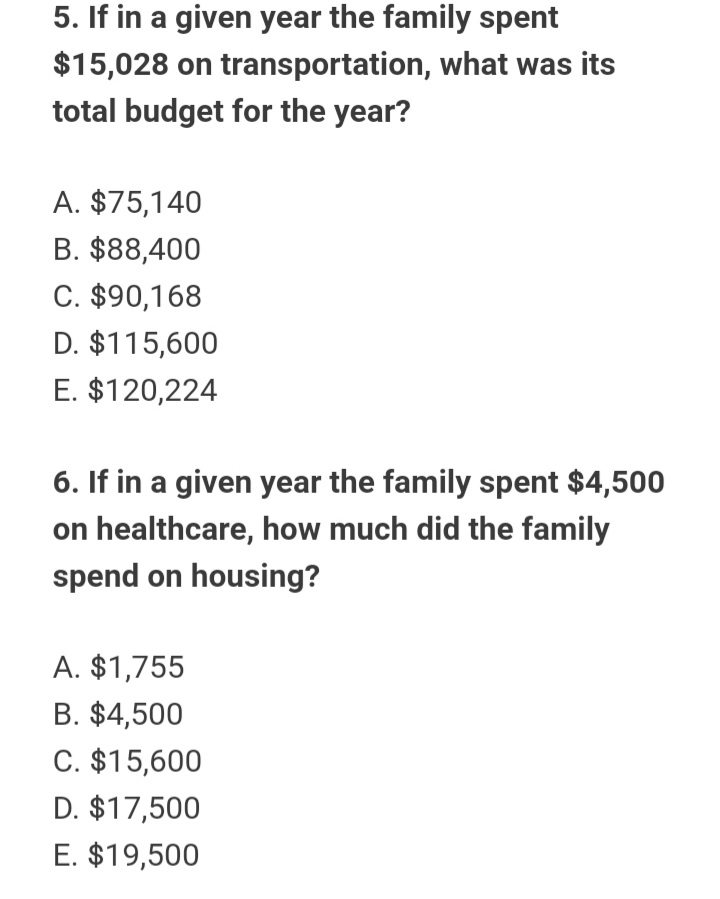
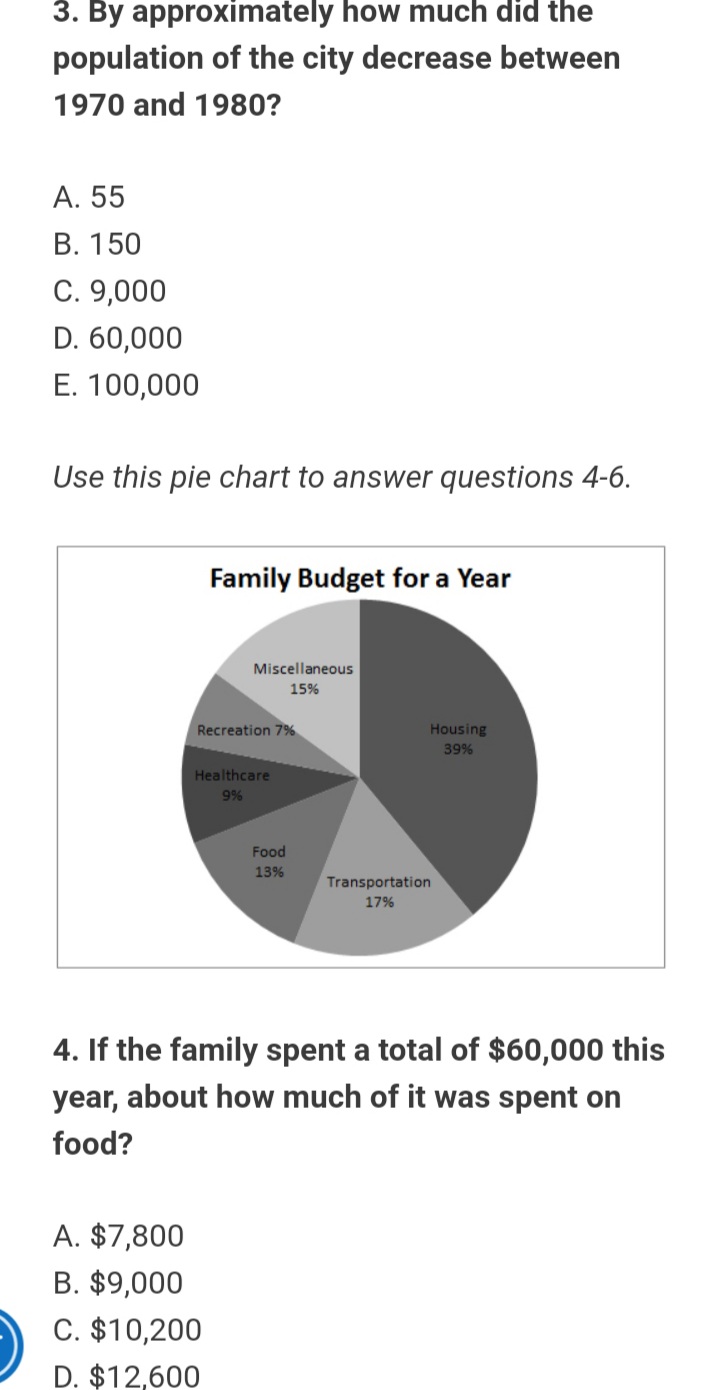
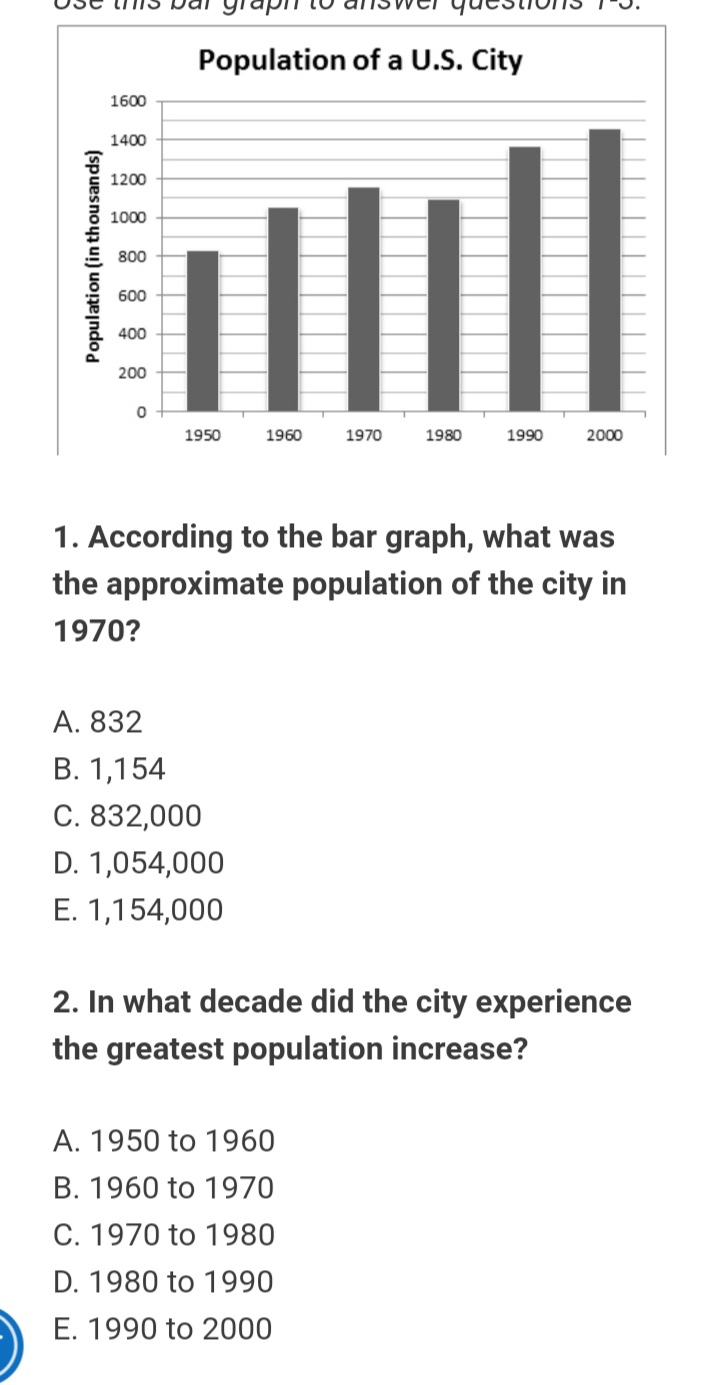
9. Prot can be found by subtracting costs from revenue. During which period did the company make the greatest prot? A. 1985 to 1986 B.1986t01987 C. 1987 to 1988 D. 1988 to 1989 E. 1989t01990 10. During what period did the company expand its production the most? A. 1985 to 1986 B. 1986 to 1987 C. 1987 to 1988 D. 1988 to 1989 E. 1989t01990 Use the line graph to answer questions 8- 10. Revenue and Costs of a Small Company $300,000 $250,000 $200,000 $150,000 Revenue Costs $100,000 $50,000 SO 1984 1985 1986 1987 1988 1989 1990 1991 8. During which period did the revenue of the company decline? A. 1985 to 1986 B. 1986 to 1987 C. 1987 to 1988 D. 1988 to 1989 E. 1989 to 1990\f5. If in a given year the family spent $15,028 on transportation, what was its total budget for the year? A. $75,140 B. $88,400 C. $90,168 D. $115,600 E. $120,224 6. If in a given year the family spent $4,500 on healthcare, how much did the family spend on housing? A. $1,755 B. $4,500 0. $15,600 D. $17,500 E. $19,500 D 3. By approximately how much did the population of the city decrease between 1970 and 1980'? A. 55 B. 150 C. 9,000 D. 60,000 E. 100,000 Use this pie chart to answer questions 4-6. Family Budget for a Year 4. If the family spent a total of $60,000 this year, about how much of it was spent on food? A. $7,800 B. $9,000 C. $10,200 D. $12.600 graph Population of a U.S. City 1600 1400 1200 1000 Population (in thousands) 800 600 400 200 0 1950 1960 1970 1980 1990 2000 1. According to the bar graph, what was the approximate population of the city in 1970? A. 832 B. 1,154 C. 832,000 D. 1,054,000 E. 1,154,000 2. In what decade did the city experience the greatest population increase? A. 1950 to 1960 B. 1960 to 1970 C. 1970 to 1980 D. 1980 to 1990 E. 1990 to 2000
Step by Step Solution
There are 3 Steps involved in it

Get step-by-step solutions from verified subject matter experts