

Question: explian the graph X Variable 1 Residual Plot 2 Besiduals 41-00-0-00-00 .0000%-10.0000% -5.0000% 0.0000% 5.0000% 10.0000% 15.0000% -2 X Variable 1
explian the graph 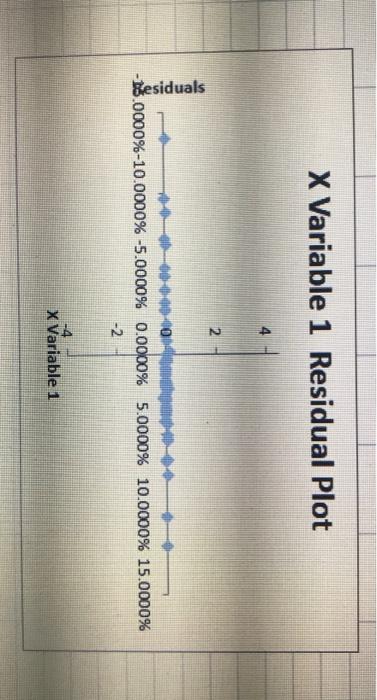
X Variable 1 Residual Plot 2 Besiduals 41-00-0-00-00 .0000%-10.0000% -5.0000% 0.0000% 5.0000% 10.0000% 15.0000% -2 X Variable 1
Step by Step Solution
There are 3 Steps involved in it
1 Expert Approved Answer
Step: 1 Unlock

Question Has Been Solved by an Expert!
Get step-by-step solutions from verified subject matter experts
Step: 2 Unlock
Step: 3 Unlock