

Question: Explicate This: Deciphering financial reporting Section for charts A & B -use the financials stated in this section to fill in charts A & B,
Explicate This:
Deciphering financial reporting
Section for charts A & B-use the financials stated in this section to fill in charts A & B, calculate all missing information
Amazon(NASDAQ: AMZN)is slated to release its Q4 and full-year 2019 results on January 30, 2020.
We believe thatAmazon's Revenues and earnings will beat consensus. We expect Amazon to reportannual revenuesof $279.3 billion which would be19.9%higher than the previous year.
Earningsare likely to be around $22.67 billion for 2019 higher than $20.15 reported in 2018.
The fourth quarterearningswill be $3.27 billion compared to $3.03 for the same period last year, andrevenuewill be a 20.9% increase over the same period's last year sales of $72.3 billion.
Due to a better Total Revenue offset by a lower net income margin. We believe that stronger-than-expected earnings and revenues for FY 2019 will likely result in a positive movement in Amazon's stock price once earnings are announced
Section for chart C-use the financials stated in this section to fill in chart C, calculate all missing information
Amazon's 3 divisions are expected to make $279.3 billion for full-year 2019
1.Amazon's North Americabusiness will contribute $168.2 billion to Amazon's 2019 revenues of Amazon's $279.3 billion in total revenues for 2019.The North America segment primarily consists of amounts earned from retail sales of consumer products and subscriptions through North America-focused online and physical stores. The North America segment contribution is more than twice any other segment.
2.Amazon International businesswill contribute $77.7 billion in revenue to total revenue. The International segment primarily consists of amounts earned from retail sales of consumer products and subscriptions through internationally focused online stores.
3.Amazon Web Serviceswill contribute $ 33.4 billion. The AWS segment consists of amounts earned from global sales of computing, storage, database, and other service offerings for start-ups, enterprises, government agencies, and academic institutions
Use the following charts to type in the financial details for Amazons total annual and 4thquarter Results. (Please review "best practices" in the assignment review slide)
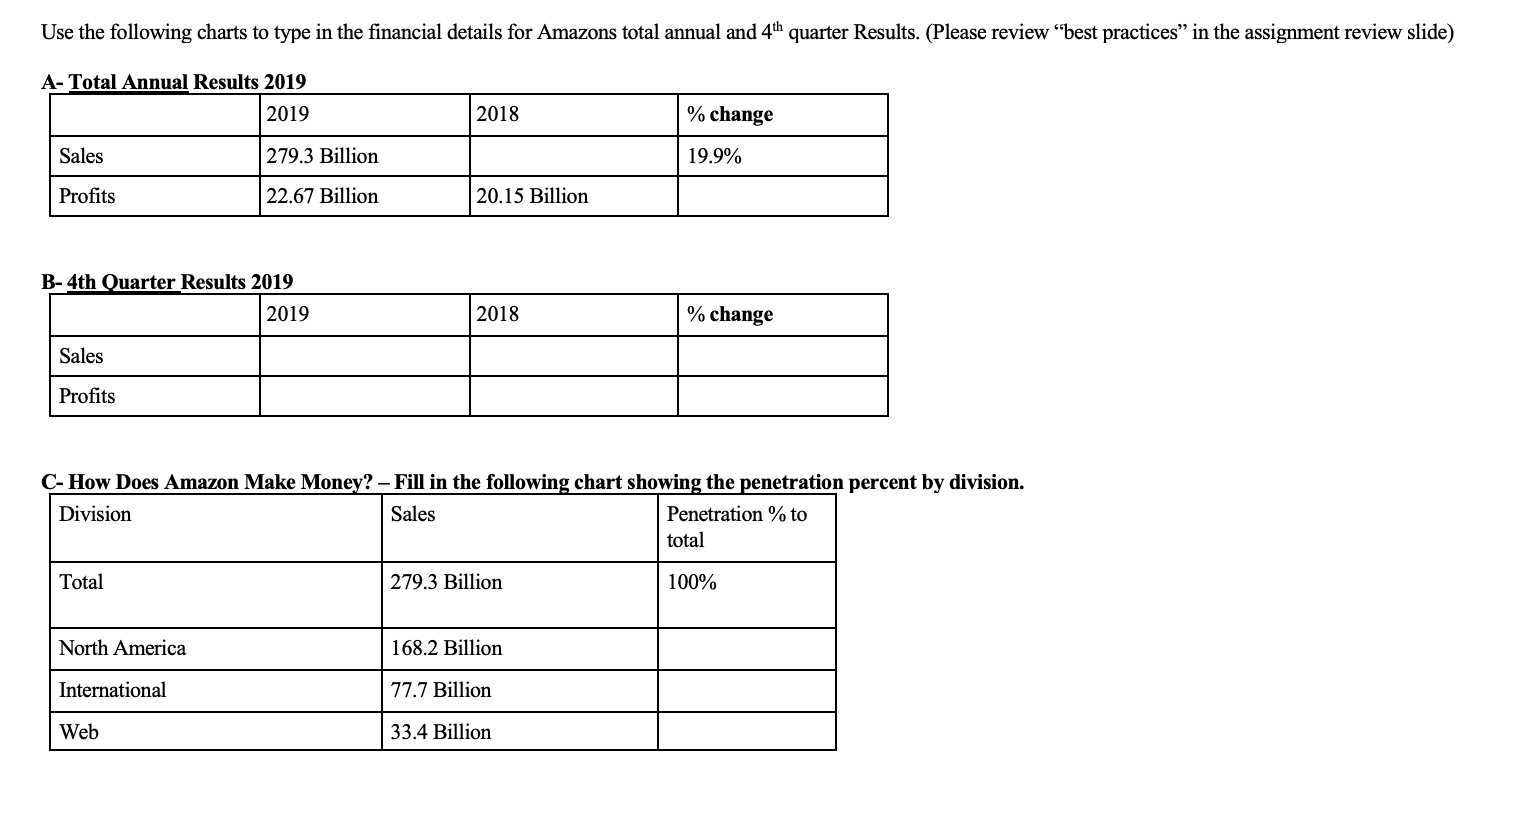
Use the following charts to type in the financial details for Amazons total annual and 4th quarter Results. (Please review "best practices" in the assignment review slide) A-Total Annual Results 2019 2019 2018 % change Sales 279.3 Billion 19.9% Profits 22.67 Billion 20.15 Billion B- 4th Quarter Results 2019 2019 2018 % change Sales Profits C- How Does Amazon Make Money? - Fill in the following chart showing the penetration percent by division. Division Sales Penetration % to total Total 279.3 Billion 100% North America 168.2 Billion International 77.7 Billion Web 33.4 Billion
Step by Step Solution
There are 3 Steps involved in it

Get step-by-step solutions from verified subject matter experts