

Question: Exploratory Data Analysis (30 points) + 5 points for a 3rd plot (extra) Descriptive statistics: report the mean, median, mode, standard deviation, etc. to summarize
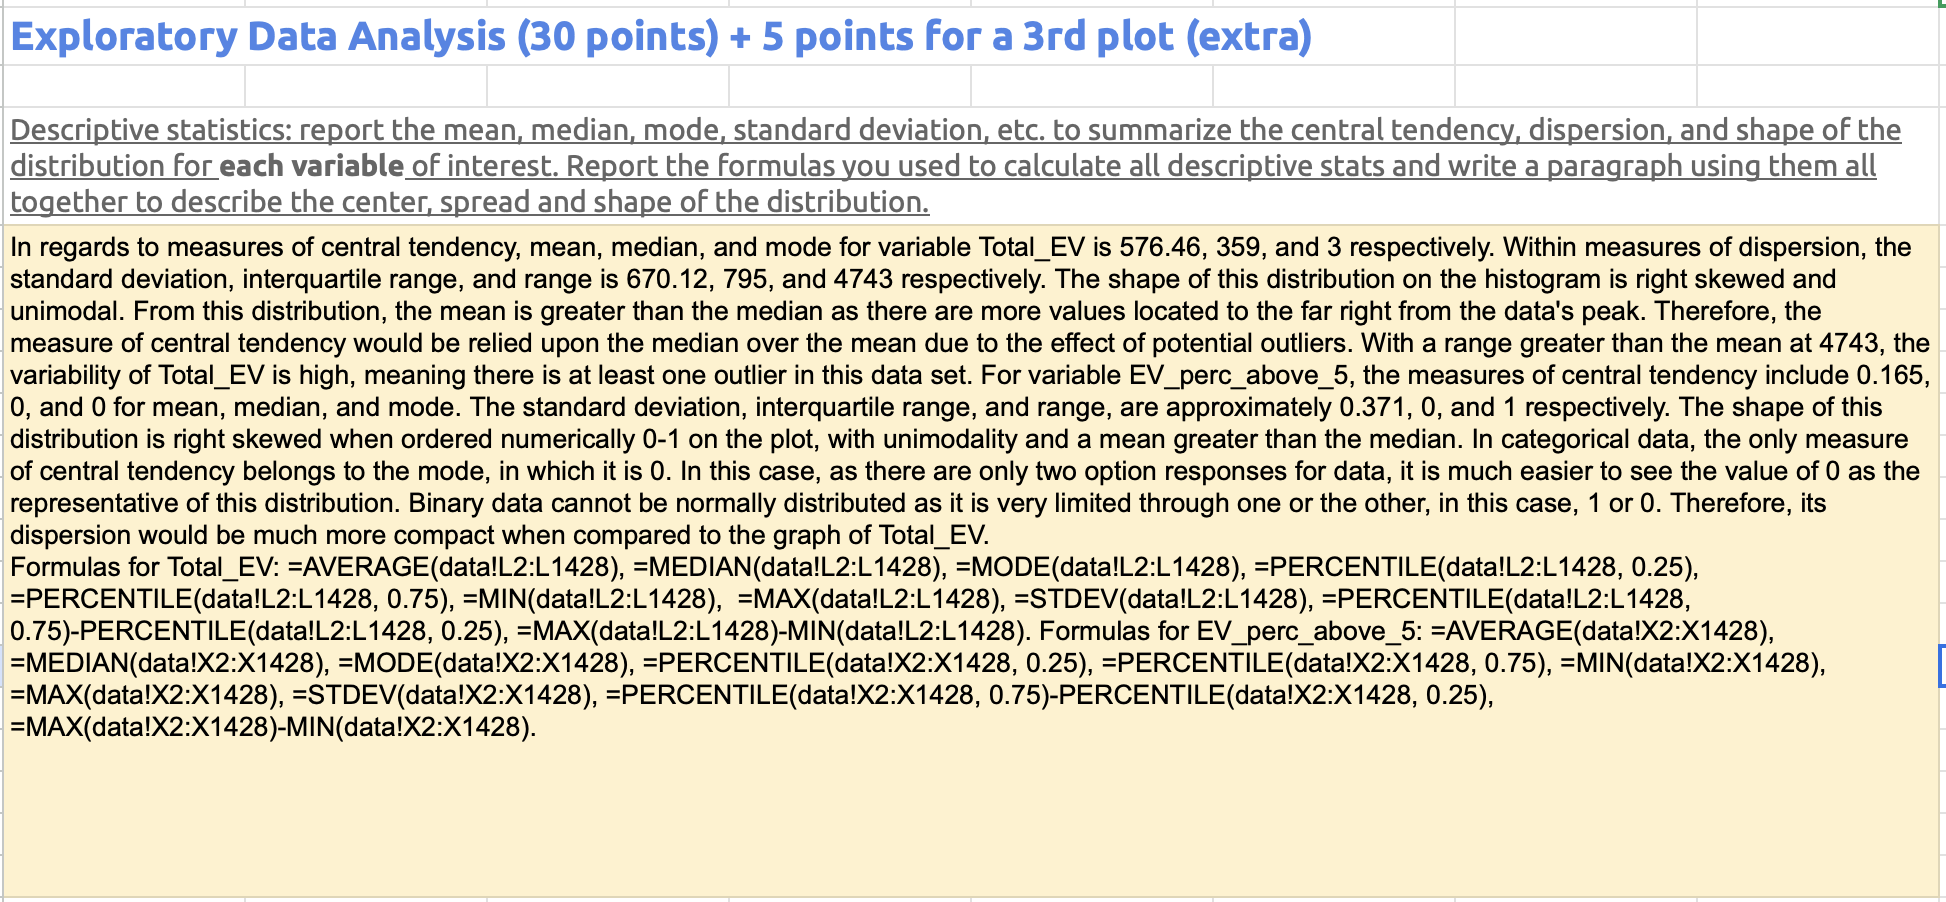
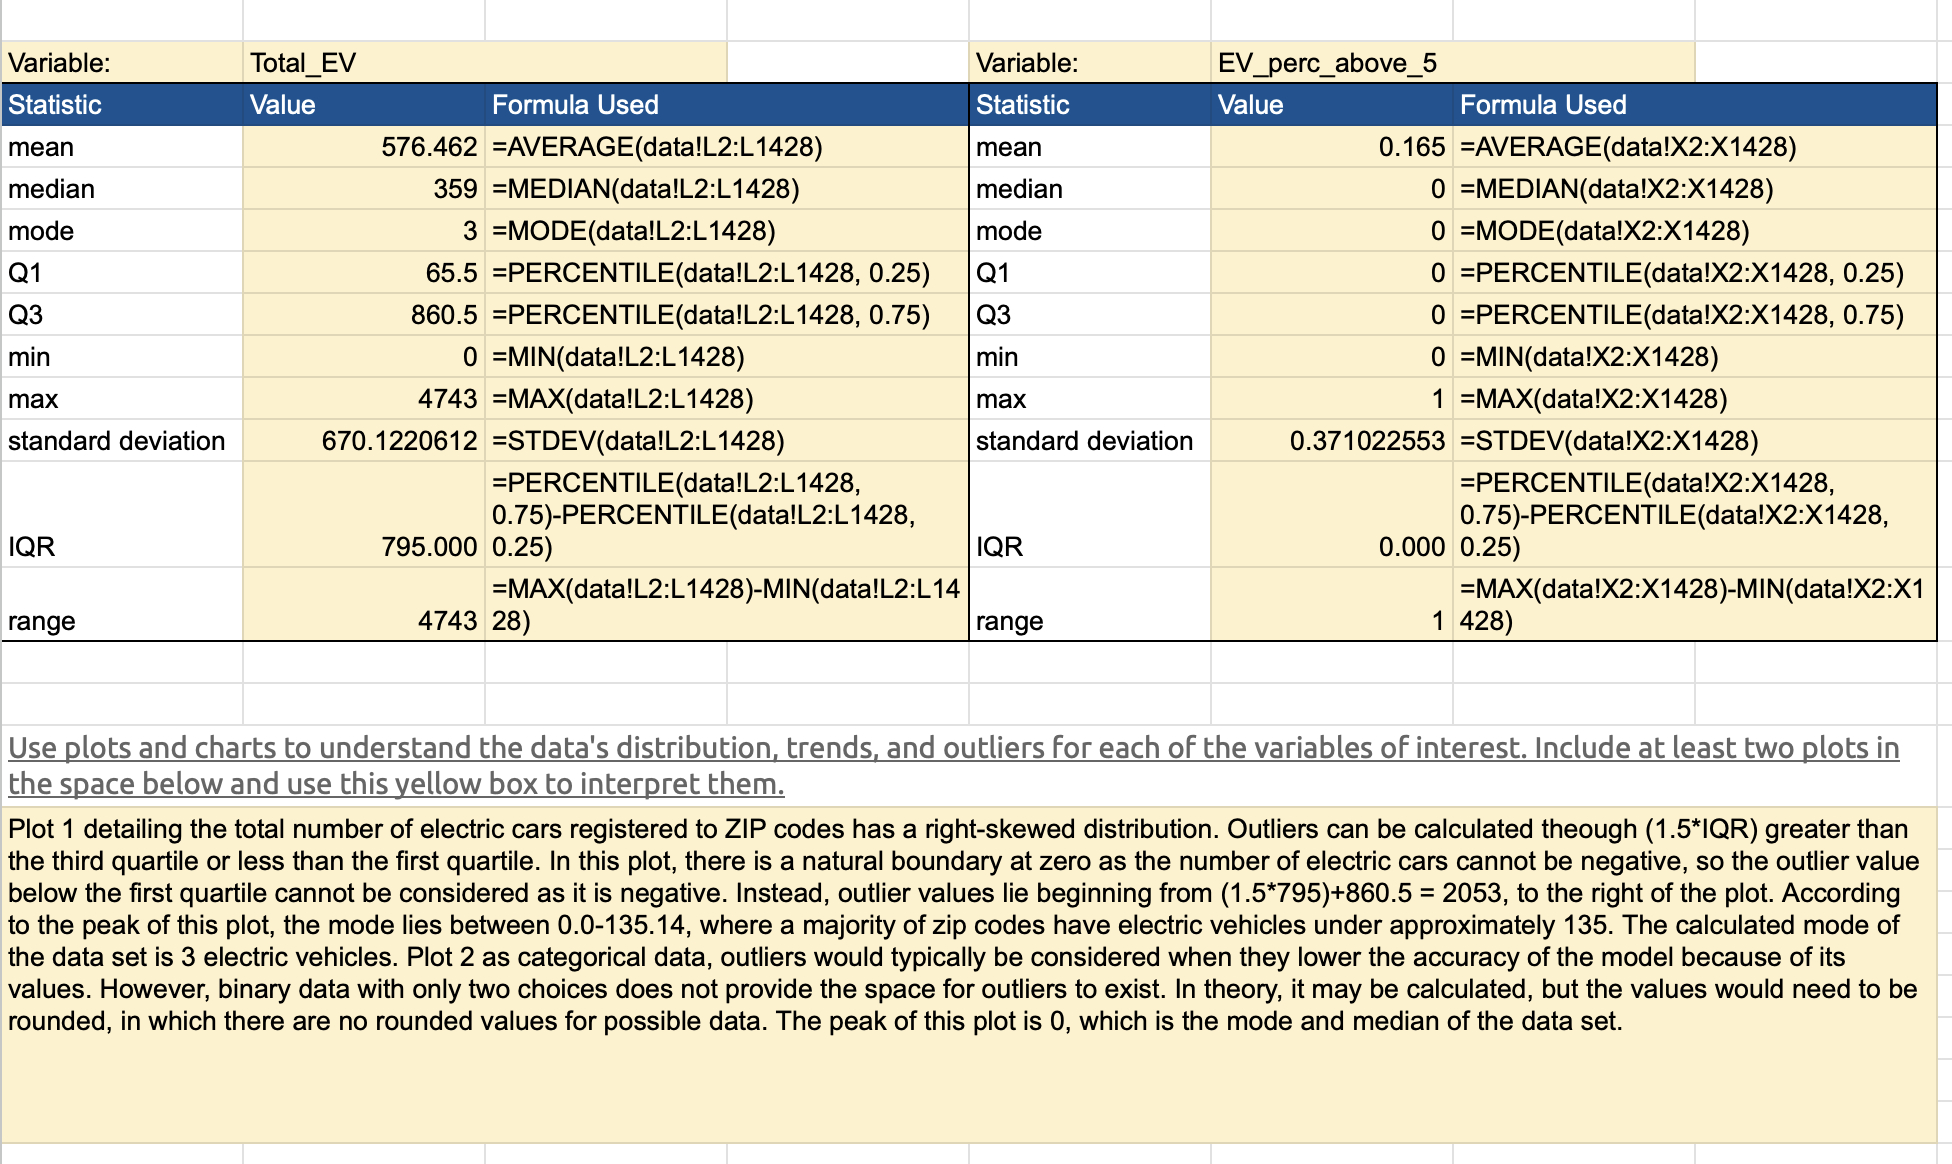
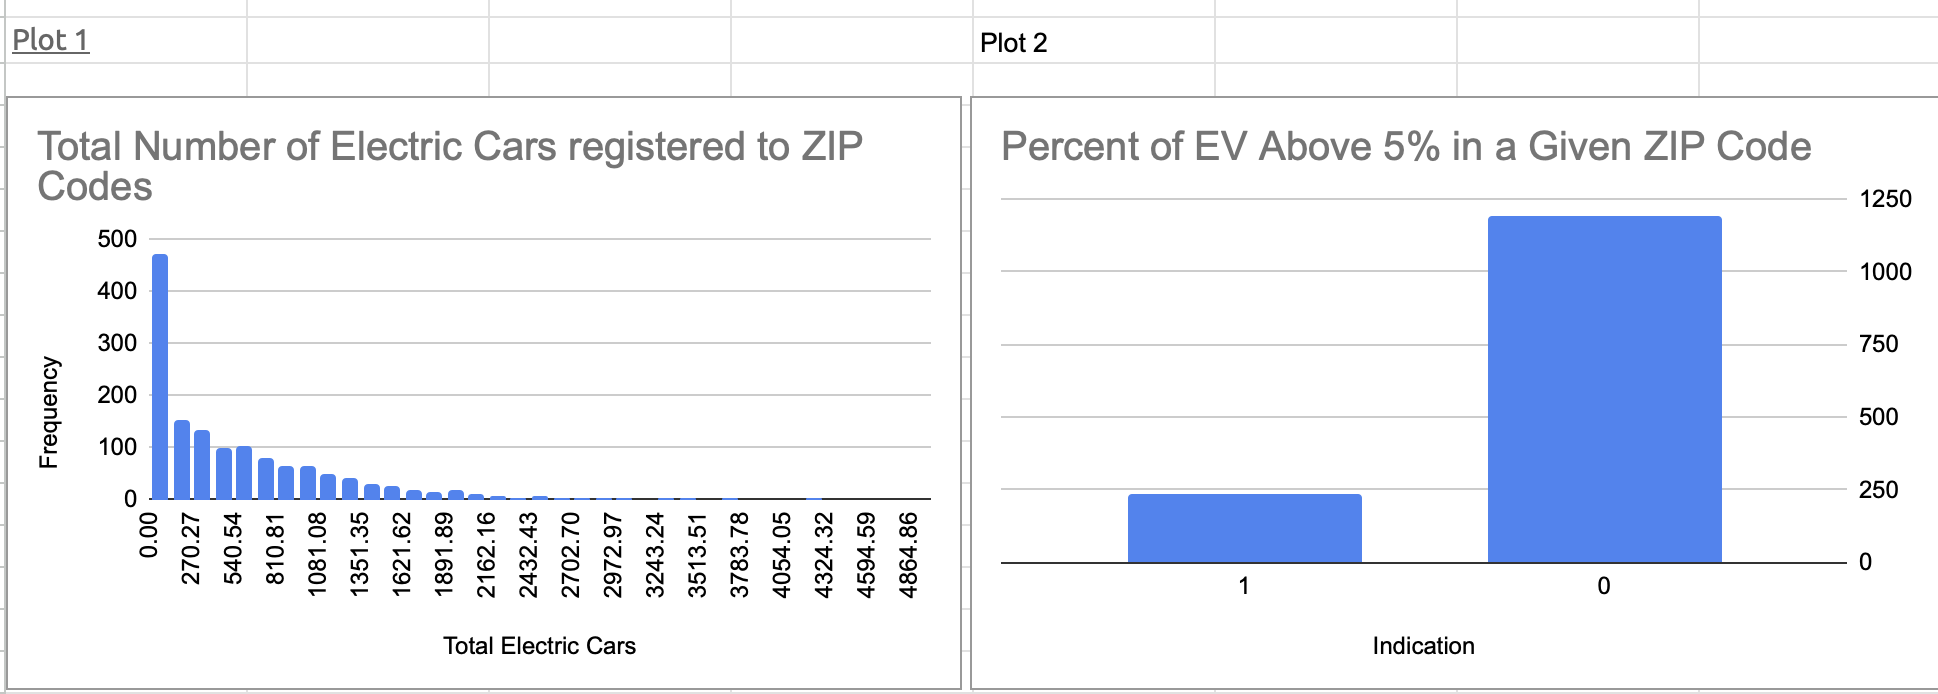
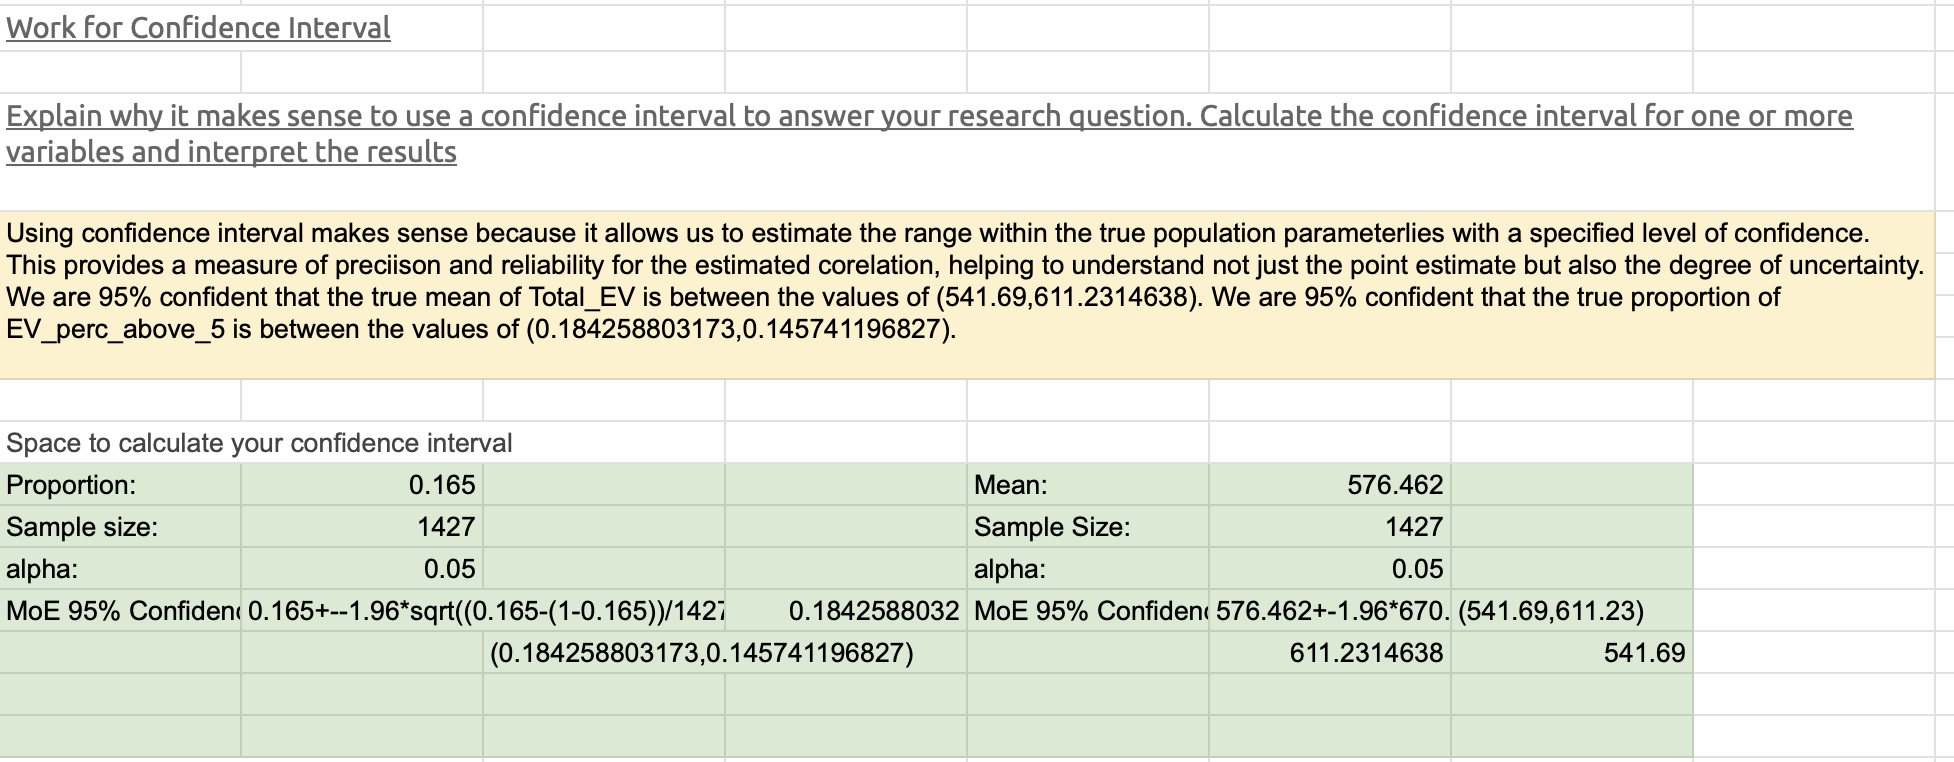
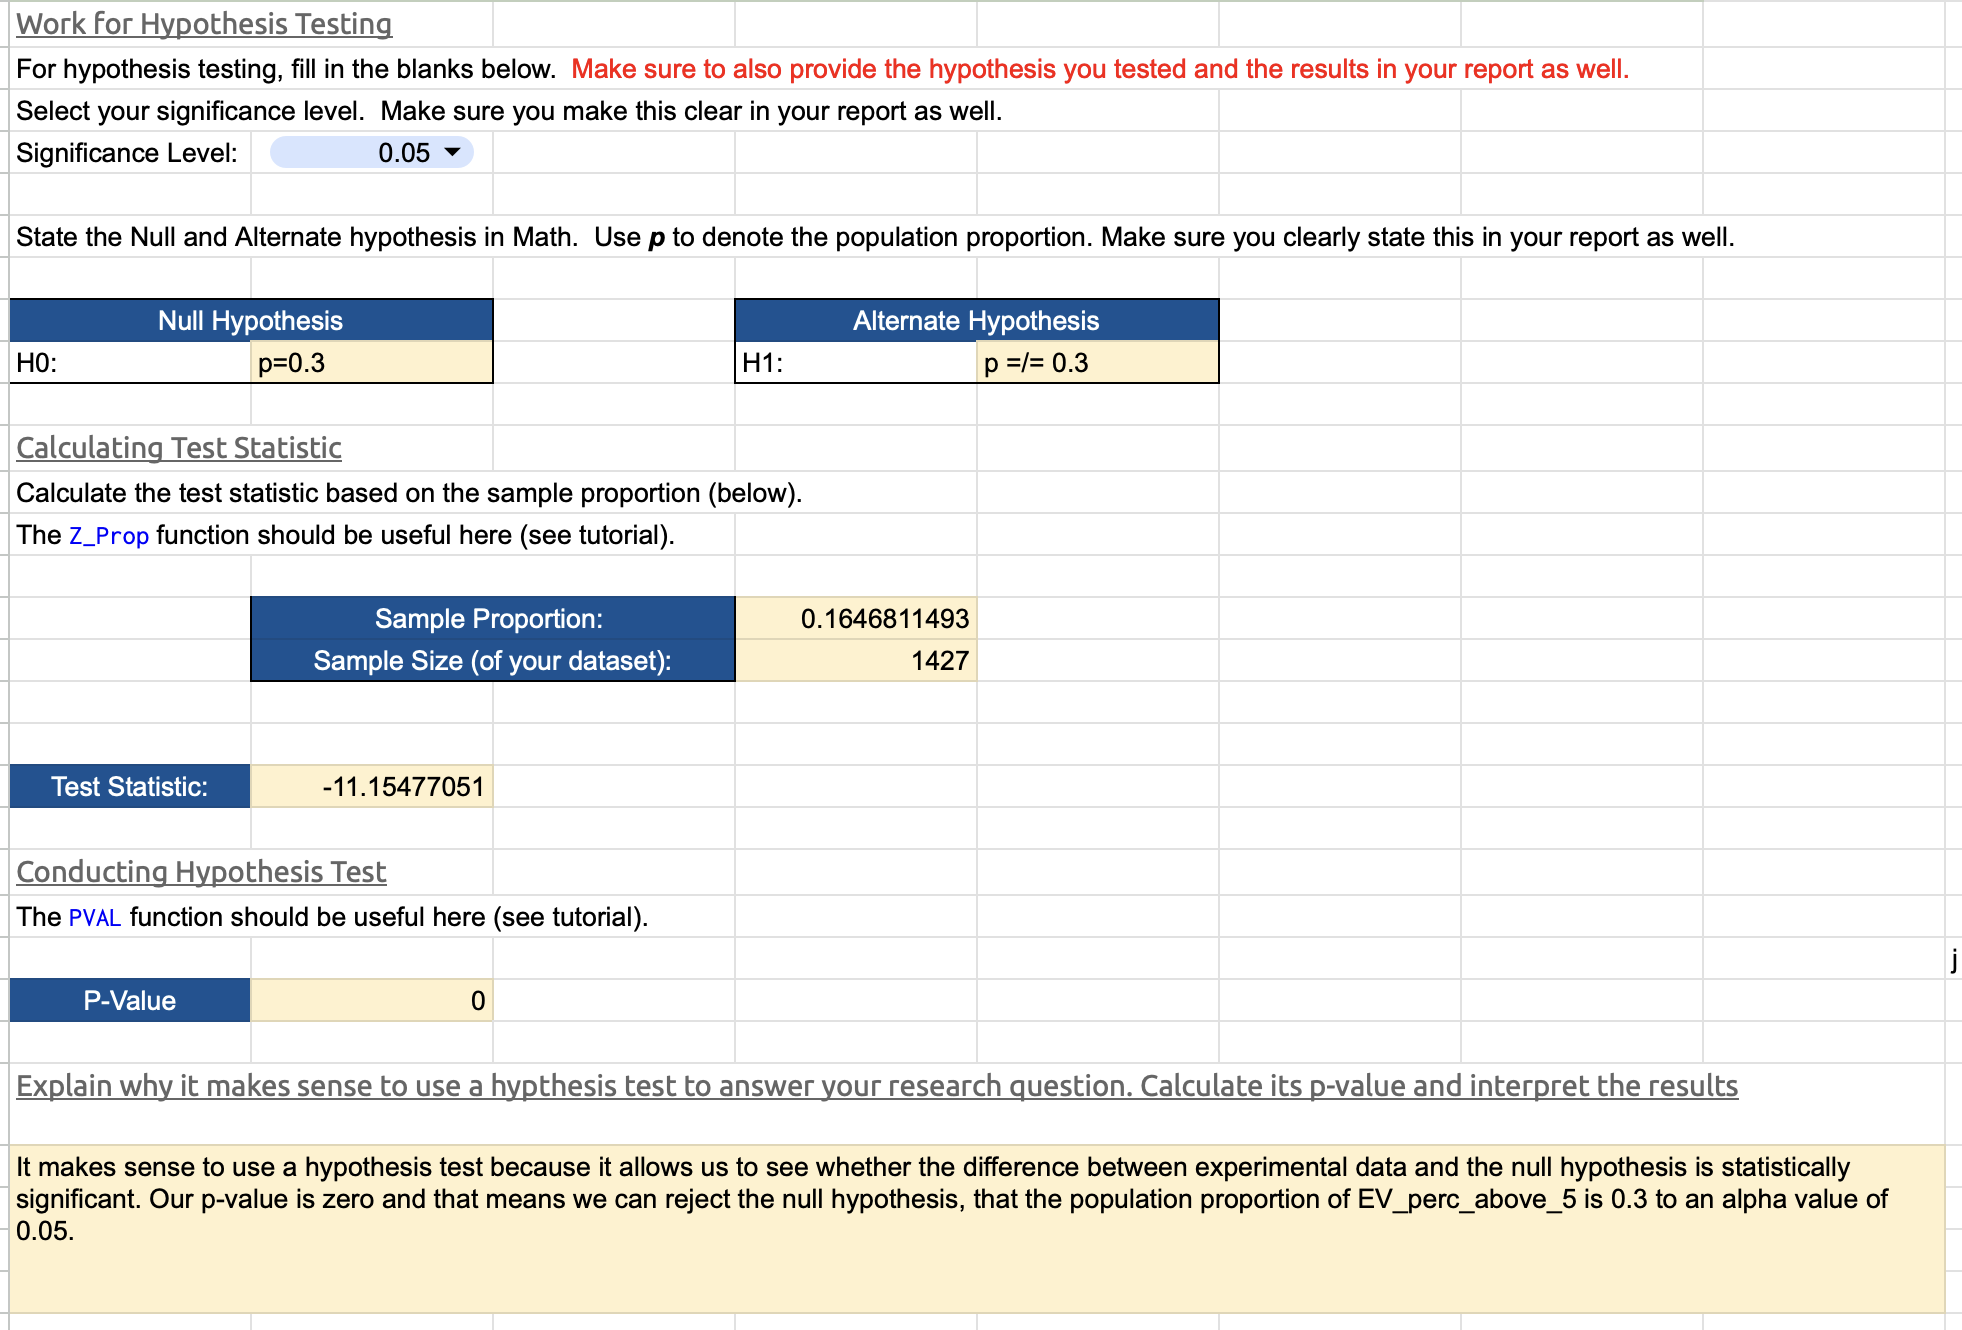

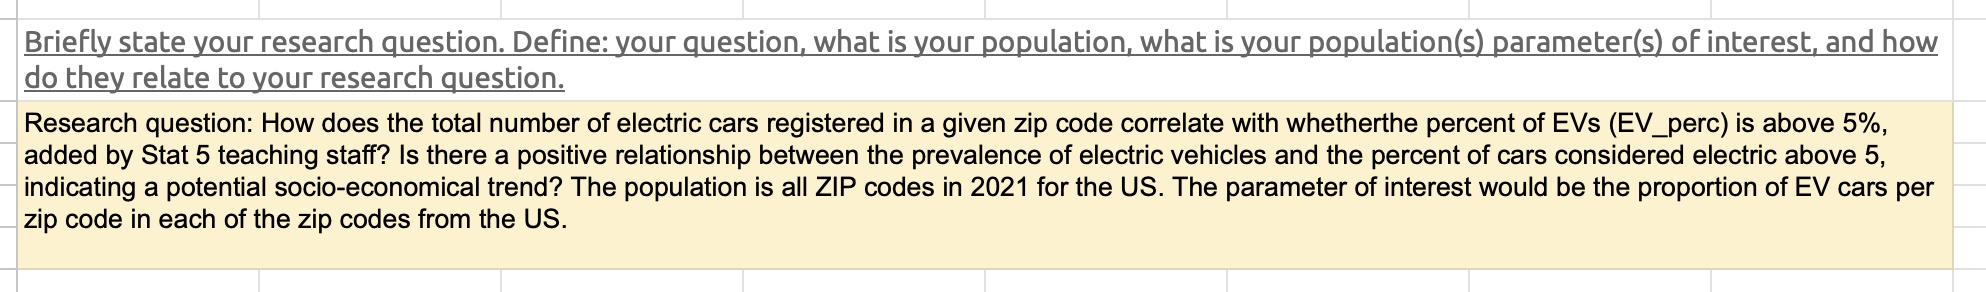
Exploratory Data Analysis (30 points) + 5 points for a 3rd plot (extra) Descriptive statistics: report the mean, median, mode, standard deviation, etc. to summarize the central tendency, dispersion, and shape of the distribution fFor each variable_of interest. Report the formulas you used to calculate all descriptive stats and write a paragraph using them all together to describe the center, spread and shape of the distribution. In regards to measures of central tendency, mean, median, and mode for variable Total_EV is 576.46, 359, and 3 respectively. Within measures of dispersion, the standard deviation, interquartile range, and range is 670.12, 795, and 4743 respectively. The shape of this distribution on the histogram is right skewed and unimodal. From this distribution, the mean is greater than the median as there are more values located to the far right from the data's peak. Therefore, the measure of central tendency would be relied upon the median over the mean due to the effect of potential outliers. With a range greater than the mean at 4743, the variability of Total_EV is high, meaning there is at least one outlier in this data set. For variable EV_perc_above_5, the measures of central tendency include 0.165, 0, and 0 for mean, median, and mode. The standard deviation, interquartile range, and range, are approximately 0.371, 0, and 1 respectively. The shape of this distribution is right skewed when ordered numerically 0-1 on the plot, with unimodality and a mean greater than the median. In categorical data, the only measure of central tendency belongs to the mode, in which it is 0. In this case, as there are only two option responses for data, it is much easier to see the value of 0 as the representative of this distribution. Binary data cannot be normally distributed as it is very limited through one or the other, in this case, 1 or 0. Therefore, its dispersion would be much more compact when compared to the graph of Total_EV. Formulas for Total_EV: =AVERAGE (data!L2:L.1428), =MEDIAN(datalL2:L1428), =MODE(data!L.2:L1428), =PERCENTILE(data!L2:L1428, 0.25), =PERCENTILE(data!L2:L.1428, 0.75), =MIN(data!L2:L1428), =MAX(datalL2:L1428), =STDEV(data!L2:L.1428), =PERCENTILE(data!L2:L.1428, 0.75)-PERCENTILE(datalL2:L1428, 0.25), =MAX(datalL2:L1428)-MIN(data!L2:L1428). Formulas for EV_perc_above_5: =AVERAGE(datalX2:X1428), =MEDIAN(data!X2:X1428), =MODE(data!X2:X1428), =PERCENTILE(data!X2:X1428, 0.25), =PERCENTILE(data!X2:X1428, 0.75), =MIN(data!X2:X1428), =MAX(data!X2:X1428), =STDEV(data!X2:X1428), =PERCENTILE(data!X2:X1428, 0.75)-PERCENTILE(data!X2:X1428, 0.25), =MAX(data!X2:X1428)-MIN(datalX2:X1428). [ Variable: Total_EV Statistic AT mean 576.462 median 359 mode 3 Q1 65.5 Q3 860.5 min 0 max 4743 standard deviation 670.1220612 IQR 795.000 range 4743 Variable: KiE R EV_perc_above 5 Formula Used AT =AVERAGE(data!L2:L1428) =MEDIAN(data!L2:L1428) =MODE(data!L2:L1428) =PERCENTILE(data!L2:L1428, 0.25) =PERCENTILE(data!L2:L1428, 0.75) =MIN(data!L2:L1428) =MAX(data!L2:L1428) =STDEV(datalL2:L1428) =PERCENTILE(data!L2:L1428, 0.75)-PERCENTILE(datalL2:L 1428, 0.25) =MAX(data!L2:L1428)-MIN(data!L2:L 14 28) 0.165 3 @ o I =] o Q w o o o o max standard deviation 0.371022553 IQR 0.000 range 1 Formula Used =AVERAGE(data!X2:X1428) =MEDIAN(data!X2:X1428) =MODE(data!X2:X1428) =PERCENTILE(data!X2:X1428, 0.25) =PERCENTILE(data!X2:X1428, 0.75) =MIN(data!X2:X1428) 1 =MAX(data!X2:X1428) =STDEV(data!X2:X1428) =PERCENTILE(data!X2:X1428, 0.75)-PERCENTILE (data!X2:X1428, 0.25) =MAX (datalX2:X1428)-MIN(data!X2:X1 428) Use plots and charts to understand the data's distribution, trends, and outliers For each of the variables of interest. Include at least two plots in the space below and use this vellow box to interpret them. Plot 1 detailing the total number of electric cars registered to ZIP codes has a right-skewed distribution. Outliers can be calculated theough (1.5*IQR) greater than the third quartile or less than the first quartile. In this plot, there is a natural boundary at zero as the number of electric cars cannot be negative, so the outlier value below the first quartile cannot be considered as it is negative. Instead, outlier values lie beginning from (1.5*795)+860.5 = 2053, to the right of the plot. According to the peak of this plot, the mode lies between 0.0-135.14, where a majority of zip codes have electric vehicles under approximately 135. The calculated mode of the data set is 3 electric vehicles. Plot 2 as categorical data, outliers would typically be considered when they lower the accuracy of the model because of its values. However, binary data with only two choices does not provide the space for outliers to exist. In theory, it may be calculated, but the values would need to be rounded, in which there are no rounded values for possible data. The peak of this plot is 0, which is the mode and median of the data set. Plot 1 Plot 2 Total Number of Electric Cars registered to ZIP Percent of EV Above 5% in a Given ZIP Code Codes 1250 500 400 1000 300 750 200 Frequency 500 100 0 250 0.00 270.27 540.54 810.81 2162.16 1081.08 1351.35 1621.62 1891.89 2702.70 3243.24 3513.51 2972.97 2432.43 4324.32 3783.78 4054.05 4594.59 4864.86 0 1 0 Total Electric Cars IndicationWork for Confidence Interval Explain why it makes sense to use a confidence interval to answer your research guestion. Calculate the confidence interval for one or more variables and interpret the results Using confidence interval makes sense because it allows us to estimate the range within the true population parameterlies with a specified level of confidence. This provides a measure of preciison and reliability for the estimated corelation, helping to understand not just the point estimate but also the degree of uncertainty. We are 95% confident that the true mean of Total_EV is between the values of (541.69,611.2314638). We are 95% confident that the true proportion of EV_perc_above_5 is between the values of (0.184258803173,0.145741196827). Space to calculate your confidence interval Proportion: 0.165 Mean: 576.462 Sample size: 1427 Sample Size: 1427 alpha: 0.05 alpha: 0.05 MoE 95% Confiden: 0.165+--1.96*sqrt((0.165-(1-0.165))/1421 0.1842588032 MoE 95% Confiden( 576.462+-1.96*670. (541.69,611.23) (0.184258803173,0.145741196827) 611.2314638 541.69 Work for Hypothesis Testing For hypothesis testing, fill in the blanks below. Make sure to also provide the hypothesis you tested and the results in your report as well. Select your significance level. Make sure you make this clear in your report as well. Significance Level: 0.05 State the Null and Alternate hypothesis in Math. Use p to denote the population proportion. Make sure you clearly state this in your report as well. Null Hypothesis Alternate Hypothesis Ho: p=0.3 H1: p=/=03 Calculating Test Statistic Calculate the test statistic based on the sample proportion (below). The Z_Prop function should be useful here (see tutorial). Sample Proportion: 0.1646811493 Sample Size (of your dataset): 1427 Test Statistic: -11.15477051 Conducting Hypothesis Test The PVAL function should be useful here (see tutorial). : Explain why it makes sense to use a hypthesis test to answer your research question. Calculate its p-value and interpret the results It makes sense to use a hypothesis test because it allows us to see whether the difference between experimental data and the null hypothesis is statistically significant. Our p-value is zero and that means we can reject the null hypothesis, that the population proportion of EV_perc_above_5 is 0.3 to an alpha value of 0.05. Write one paragraph concluding your results together: EDA, confidence interval and hypothesis test. How would you answer your initial research question? Briefly state your research question. Define: your question, what is your population, what is your population(s) parameter(s) of interest, and how do they relate to your research question. Research question: How does the total number of electric cars registered in a given zip code correlate with whetherthe percent of EVs (EV_perc) is above 5%, added by Stat 5 teaching staff? Is there a positive relationship between the prevalence of electric vehicles and the percent of cars considered electric above 5, indicating a potential socio-economical trend? The population is all ZIP codes in 2021 for the US. The parameter of interest would be the proportion of EV cars per zip code in each of the zip codes from the US
Step by Step Solution
There are 3 Steps involved in it

Get step-by-step solutions from verified subject matter experts