

Question: Exploratory Data Analysis: The following graph shows real data on the weights and ages of a sample of black bears. You may assume the sample
Exploratory Data Analysis: The following graph shows real data on the weights and ages of a sample of black bears. You may assume the sample is a random sample of a B.C. bear population. Describe what you see in this graph. Your description should use any relevant technical terms you have learned in this course as well as any relevant general knowledge of bears.
Please answer to the points and no more than 160 words
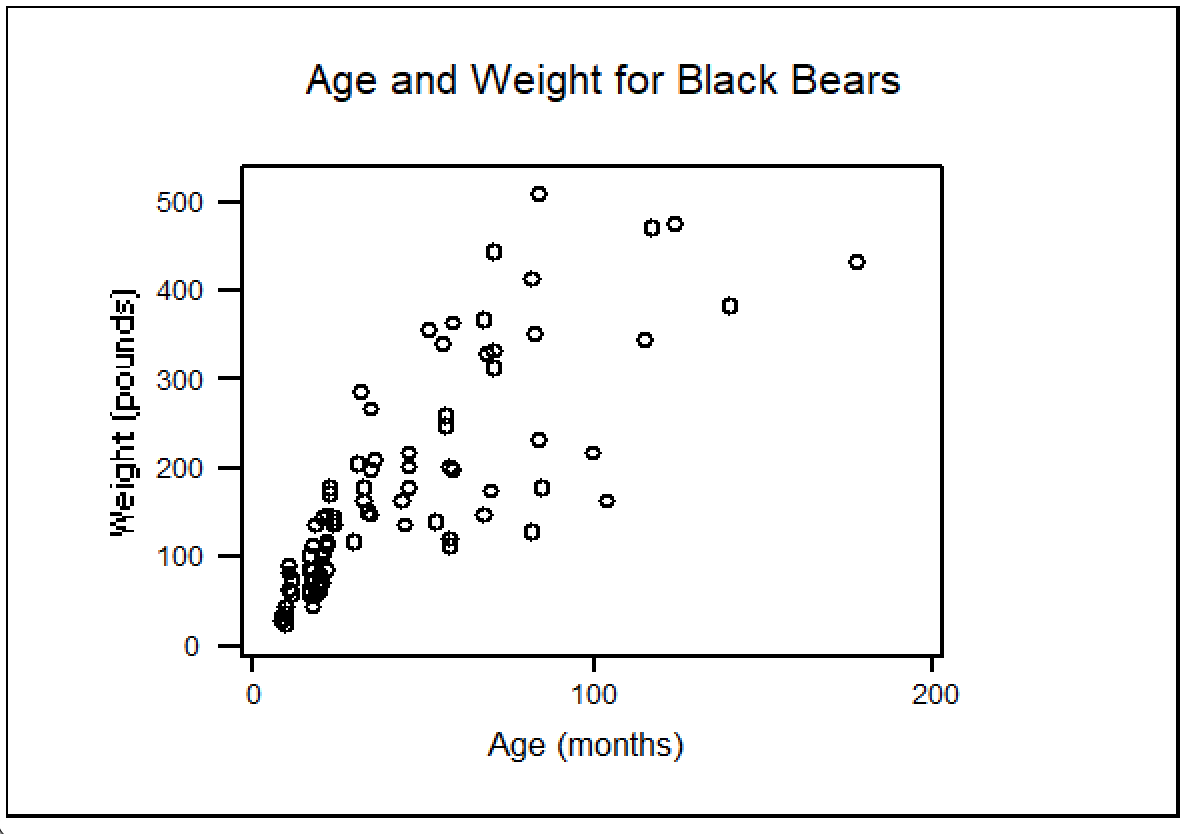
Age and Weight for Black Bears 500 00 400 O 300 Weight [pounds) 200 100 0 100 200 Age (months)
Step by Step Solution
There are 3 Steps involved in it
1 Expert Approved Answer
Step: 1 Unlock

Question Has Been Solved by an Expert!
Get step-by-step solutions from verified subject matter experts
Step: 2 Unlock
Step: 3 Unlock