

Question: Exploratory Data Analysis with Python In this assignment, you have been provided with a dataset that contains unit cost, sales, and profit as a synthetic
Exploratory Data Analysis with Python
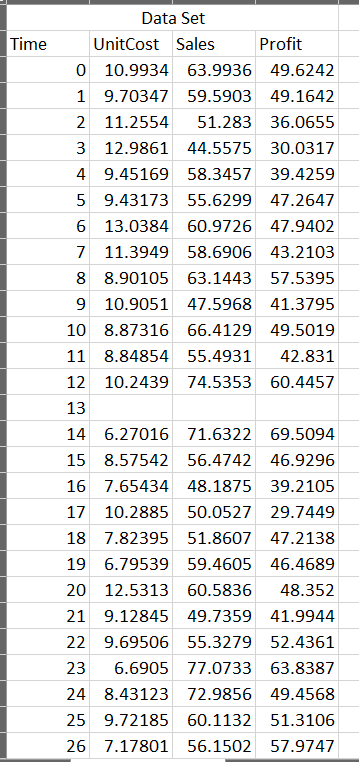
In this assignment, you have been provided with a dataset that contains unit cost, sales, and profit as a synthetic dataset designed to simulate realworld scenarios. However, the dataset is not perfect and presents some challenges that you must overcome. It contains missing values and outliers, which can significantly impact your analysis and predictions. Your task is to navigate through these obstacles and extract meaningful information from the data.
Open a new Google Colab notebook and import the necessary libraries.
Upload the dataset into the notebook.
Open the provided dataset on Colab and perform an exploratory data analysis EDA on the dataset in the following steps:
Analyze the dataset. Describe the overall trend, identify any upward, downward, cyclic or seasonal patterns, and explain your insights on the data's implications and influencing factors.
Identify and describe missing values.
Apply appropriate technique to handle missing values in the dataset. Present 'before' and 'after' plots of the dataset to demonstrate the effectiveness of your technique.
Apply a moving average technique with appropriate windows size to smooth out the data and observe any patterns or trends. Present the plot of the each feature with moving average line to show the technique effectiveness.
Identify and describe outliers using histograms.
Perform correlation analysis on the cleaned dataset. Identify relevant variables and calculate their correlation coefficients. Interpret the correlation coefficients to understand the relationships between variables.
Discuss the potential impact of the data quality issues on subsequent analysis or decisionmaking if left unaddressed. Explain how the data cleaning process contributes to ensuring reliable and accurate insights from the dataset.tableData SetTimeUnitCost,Sales,Profit,
Step by Step Solution
There are 3 Steps involved in it
1 Expert Approved Answer
Step: 1 Unlock

To perform exploratory data analysis EDA on the provided dataset using Python follow these steps Step 1 Set Up Your Environment Open Google Colab Crea... View full answer
Question Has Been Solved by an Expert!
Get step-by-step solutions from verified subject matter experts
Step: 2 Unlock
Step: 3 Unlock