

Question: Analyzing then interpreting them - evaluate the reason of two trends of Apple's financial statement. 1. From the beginning of 2000 to its peak in
Analyzing then interpreting them - evaluate the reason of two trends of Apple's financial statement.
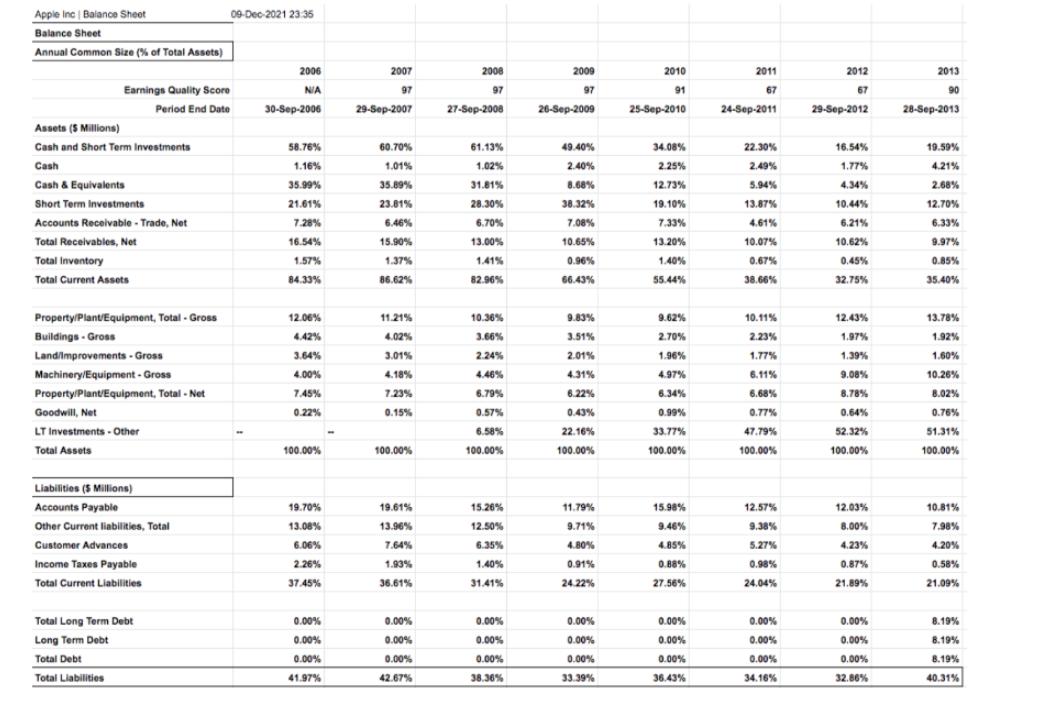
1. From the beginning of 2000 to its peak in 2012, Apple’s stock price increased by more than 25 times, from $27.97 to $702.10. Examine ONLY the financial reports (in the appendices) and identify areas that were responsible for this stock performance.
2. From its peak in September 2012 to the end of March 2013, Apple’s stock price fell by 37%, from $702.10 to $442.66. Examine ONLY the financial reports (in the appendices) and identify areas that were responsible for this stock performance.
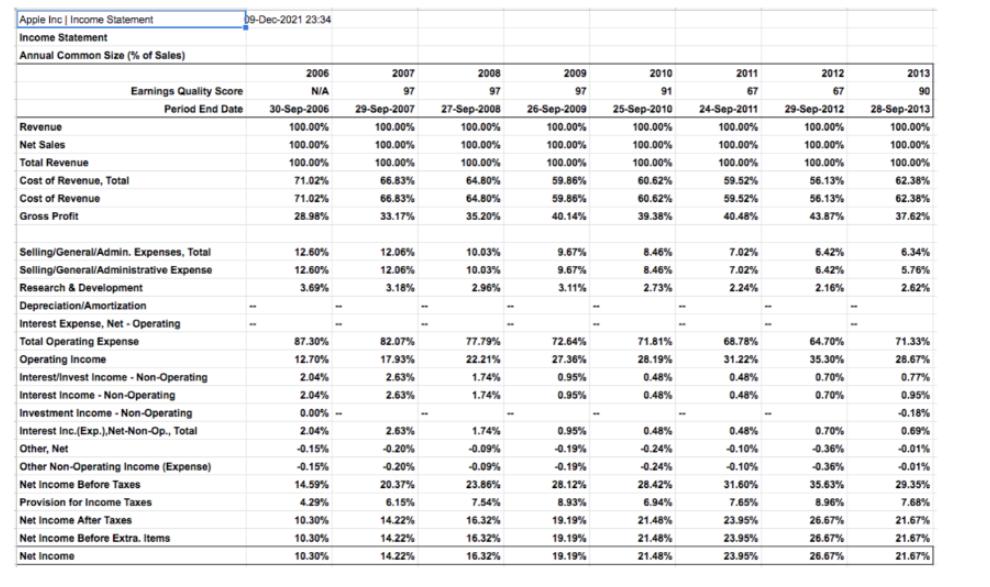
Apple Inc | Income Statement Income Statement Annual Common Size (% of Sales) Revenue Net Sales Total Revenue Cost of Revenue, Total Cost of Revenue Gross Profit Selling/General/Admin. Expenses, Total Selling/General/Administrative Expense Research & Development Depreciation/Amortization Interest Expense, Net-Operating Total Operating Expense Operating Income Interest/Invest Income -Non-Operating Interest Income -Non-Operating Investment Income -Non-Operating Interest Inc.(Exp.),Net-Non-Op., Total Other, Net Other Non-Operating Income (Expense) Net Income Before Taxes Provision for Income Taxes Net Income After Taxes Net Income Before Extra. Items Net Income Earnings Quality Score Period End Date 09-Dec-2021 23:34 2006 N/A 30-Sep-2006 100.00% 100.00% 100.00% 71.02% 71.02% 28.98% 12.60% 12.60% 3.69% 87.30% 12.70% 2.04% 2.04% 0.00%-> 2.04% -0.15% -0.15% 14.59% 4.29% 10.30% 10.30% 10.30% 2007 97 29-Sep-2007 100.00% 100.00% 100.00% 66.83% 66.83% 33.17% 12.06% 12.06% 3.18% 82.07% 17.93% 2.63% 2.63% 2.63% -0.20% -0.20% 20.37% 6.15% 14.22% 14.22% 14.22% 2008 97 27-Sep-2008 100.00% 100.00% 100.00% 64.80% 64.80% 35.20% 10.03% 10.03% 2.96% 77.79% 22.21% 1.74% 1.74% 1.74% -0.09% -0.09% 23.86% 7.54% 16.32% 16.32% 16.32% 2009 97 26-Sep-2009 100.00% 100.00% 100.00% 59.86% 59.86% 40.14% 9.67% 9.67% 3.11% 72.64% 27.36% 0.95% 0.95% 0.95% -0.19% -0.19% 28.12% 8.93% 19.19% 19.19% 19.19% 2010 91 25-Sep-2010 100.00% 100.00% 100.00% 60.62% 60.62% 39.38% 8.46% 8.46% 2.73% 71.81% 28.19% 0.48% 0.48% 0.48% -0.24% -0.24% 28.42% 6.94% 21.48% 21.48% 21.48% 2011 67 24-Sep-2011 100.00% 100.00% 100.00% 59.52% 59.52% 40.48% 7.02% 7.02% 2.24% 68.78% 31.22% 0.48% 0.48% 0.48% -0.10% -0.10% 31.60% 7.65% 23.95% 23.95% 23.95% 2012 67 29-Sep-2012 100.00% 100.00% 100.00% 56.13% 56.13% 43.87% 6.42% 6.42% 2.16% 64.70% 35.30% 0.70% 0.70% 0.70% -0.36% -0.36% 35.63% 8.96% 26.67% 26.67% 26.67% 2013 90 28-Sep-2013 100.00% 100.00% 100.00% 62.38% 62.38% 37.62% 6.34% 5.76% 2.62% 71.33% 28.67% 0.77% 0.95% -0.18% 0.69% -0.01% -0.01% 29.35% 7.68% 21.67% 21.67% 21.67%
Step by Step Solution
3.61 Rating (166 Votes )
There are 3 Steps involved in it
1 From the beginning of 2000 to its peak in 2012 Apples stock price increased by more than 25 times from 2797 to 70210 Examine ONLY the financial repo... View full answer

Get step-by-step solutions from verified subject matter experts