

Question: explore currency rates and see how they affect the over/undervaluation of the U.S. dollar. The Big Mac index was invented by The Economist in 1986
explore currency rates and see how they affect the over/undervaluation of the U.S. dollar.
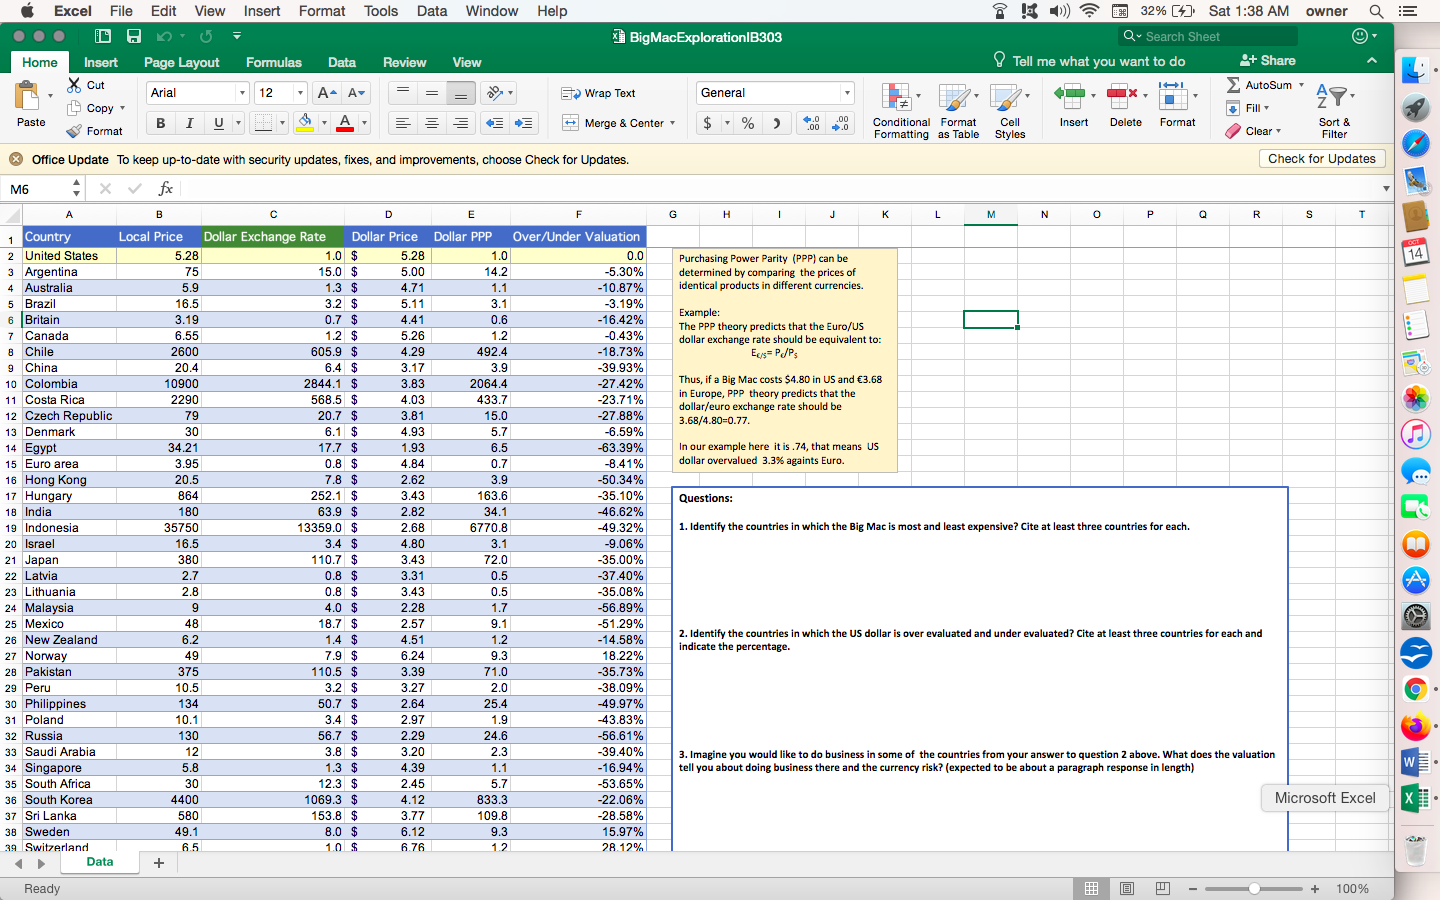
The Big Mac index was invented by The Economist in 1986 as "a lighthearted guide to whether currencies are at their "correct" level. It is based on the theory of purchasing-power parity (PPP), the notion that in the long run, exchange rates should move towards the rate that would equalise the prices of an identical basket of goods and services (in this case, a burger) in any two countries https://www.economist.com/big-mac-index
1. Look at BigMac excel files
analyze the data within the Excel file:
- Update the exchange rates against the U.S. dollar for each country (Column C).
- cite the source used to obtain the exchange rate. Foreign exchange trading sites like OANDA or Yahoo Finance are a good place to start.
- Using the data that was gathered from the previous step
- Identify the countries in which the Big Mac is most and least expensive. Cite at least three countries for each.
- Identify the countries in which the U.S. dollar is overevaluated and underevaluated. Cite at least three countries for each, and indicate the percentage.
- Imagine someone would like to do business in some of the countries from your answer to Question 2 above. What does the valuation tell about doing business there and the currency risk?
![[4] Sat 1:38 AM owner Q Search Sheet Tell me what you](https://dsd5zvtm8ll6.cloudfront.net/si.experts.images/questions/2024/05/663a26ea5f954_082663a26ea32ca1.jpg)
Excel File Edit View Insert Format Tools Data Window Help BigMacExploration|B303 32% [4] Sat 1:38 AM owner Q Search Sheet Tell me what you want to do Home Insert Page Layout Formulas Data Review View Cut Arial 12 A A Wrap Text General + Share AutoSum Copy Paste BIU Merge & Center $ %> .00 .00 -.0 Format Office Update To keep up-to-date with security updates, fixes, and improvements, choose Check for Updates. Conditional Format Formatting as Table Cell Styles Insert Delete Format Fill Clear Sort & Filter Check for Updates M6 xfx A B D E F G H 1 J K L M N P Q S T 1 Country Local Price Dollar Exchange Rate Dollar Price Dollar PPP Over/Under Valuation 2 United States 5.28 1.0 $ 5.28 1.0 3 Argentina 75 15.0 $ 5.00 14.2 0.0 -5.30% 4 Australia 5.9 1.3 $ 4.71 1.1 -10.87% 5 Brazil 16.5 3.2 $ 5.11 3.1 -3.19% 6 Britain 3.19 0.7 $ 4.41 0.6 -16.42% 7 Canada 6.55 1.2 $ 5.26 1.2 -0.43% 8 Chile 2600 605.9 $ 4.29 492.4 -18.73% 9 China 20.4 6.4 $ 3.17 3.9 -39.93% 10 Colombia 10900 2844.1 $ 3.83 2064.4 -27.42% 11 Costa Rica 2290 568.5 $ 4.03 433.7 -23.71% 12 Czech Republic 79 20.7 $ 3.81 15.0 -27.88% 13 Denmark 30 6.1 $ 4.93 5.7 -6.59% 14 Egypt 34.21 17.7 $ 1.93 6.5 -63.39% 15 Euro area 3.95 0.8 $ 4.84 0.7 -8.41% 16 Hong Kong 20.5 7.8 $ 2.62 3.9 -50.34% 17 Hungary 864 252.1 $ 3.43 163.6 -35.10% Purchasing Power Parity (PPP) can be determined by comparing the prices of identical products in different currencies. Example: The PPP theory predicts that the Euro/US dollar exchange rate should be equivalent to: Ex/s = Pe/Ps Thus, if a Big Mac costs $4.80 in US and 3.68 in Europe, PPP theory predicts that the dollar/euro exchange rate should be 3.68/4.80=0.77. In our example here it is .74, that means US dollar overvalued 3.3% againts Euro. Questions: Oct 14 18 India 180 63.9 $ 2.82 19 Indonesia 35750 13359.0 $ 2.68 34.1 6770.8 -46.62% -49.32% 1. Identify the countries in which the Big Mac is most and least expensive? Cite at least three countries for each. 20 Israel 16.5 3.4 $ 4.80 3.1 -9.06% 21 Japan 380 110.7 $ 3.43 72.0 -35.00% 22 Latvia 2.7 0.8 $ 3.31 0.5 -37.40% A- 23 Lithuania 2.8 0.8 $ 3.43 0.5 -35.08% 24 Malaysia 9 4.0 $ 2.28 1.7 -56.89% 25 Mexico 48 18.7 $ 2.57 9.1 -51.29% 26 New Zealand 6.2 1.4 $ 4.51 1.2 -14.58% 27 Norway 49 7.9 $ 6.24 9.3 18.22% 2. Identify the countries in which the US dollar is over evaluated and under evaluated? Cite at least three countries for each and indicate the percentage. 28 Pakistan 375 110.5 $ 3.39 71.0 -35.73% 29 Peru 10.5 3.2 $ 3.27 2.0 -38.09% 30 Philippines 134 50.7 $ 2.64 25.4 -49.97% 31 Poland 10.1 3.4 $ 2.97 1.9 -43.83% 32 Russia 130 56.7 $ 2.29 24.6 -56.61% 33 Saudi Arabia 12 3.8 $ 3.20 2.3 34 Singapore 5.8 1.3 $ 4.39 1.1 -39.40% -16.94% 3. Imagine you would like to do business in some of the countries from your answer to question 2 above. What does the valuation tell you about doing business there and the currency risk? (expected to be about a paragraph response in length) W 35 South Africa 30 12.3 $ 2.45 5.7 -53.65% 36 South Korea 4400 1069.3 $ 4.12 833.3 -22.06% Microsoft Excel X 37 Sri Lanka 580 153.8 $ 3.77 109.8 -28.58% 38 Sweden 49.1 8.0 $ 6.12 9.3 15.97% 39 Switzerland 6.5 10 $ 6.76 1.2 28.12% Data + Ready + 100%
Step by Step Solution
There are 3 Steps involved in it

Get step-by-step solutions from verified subject matter experts