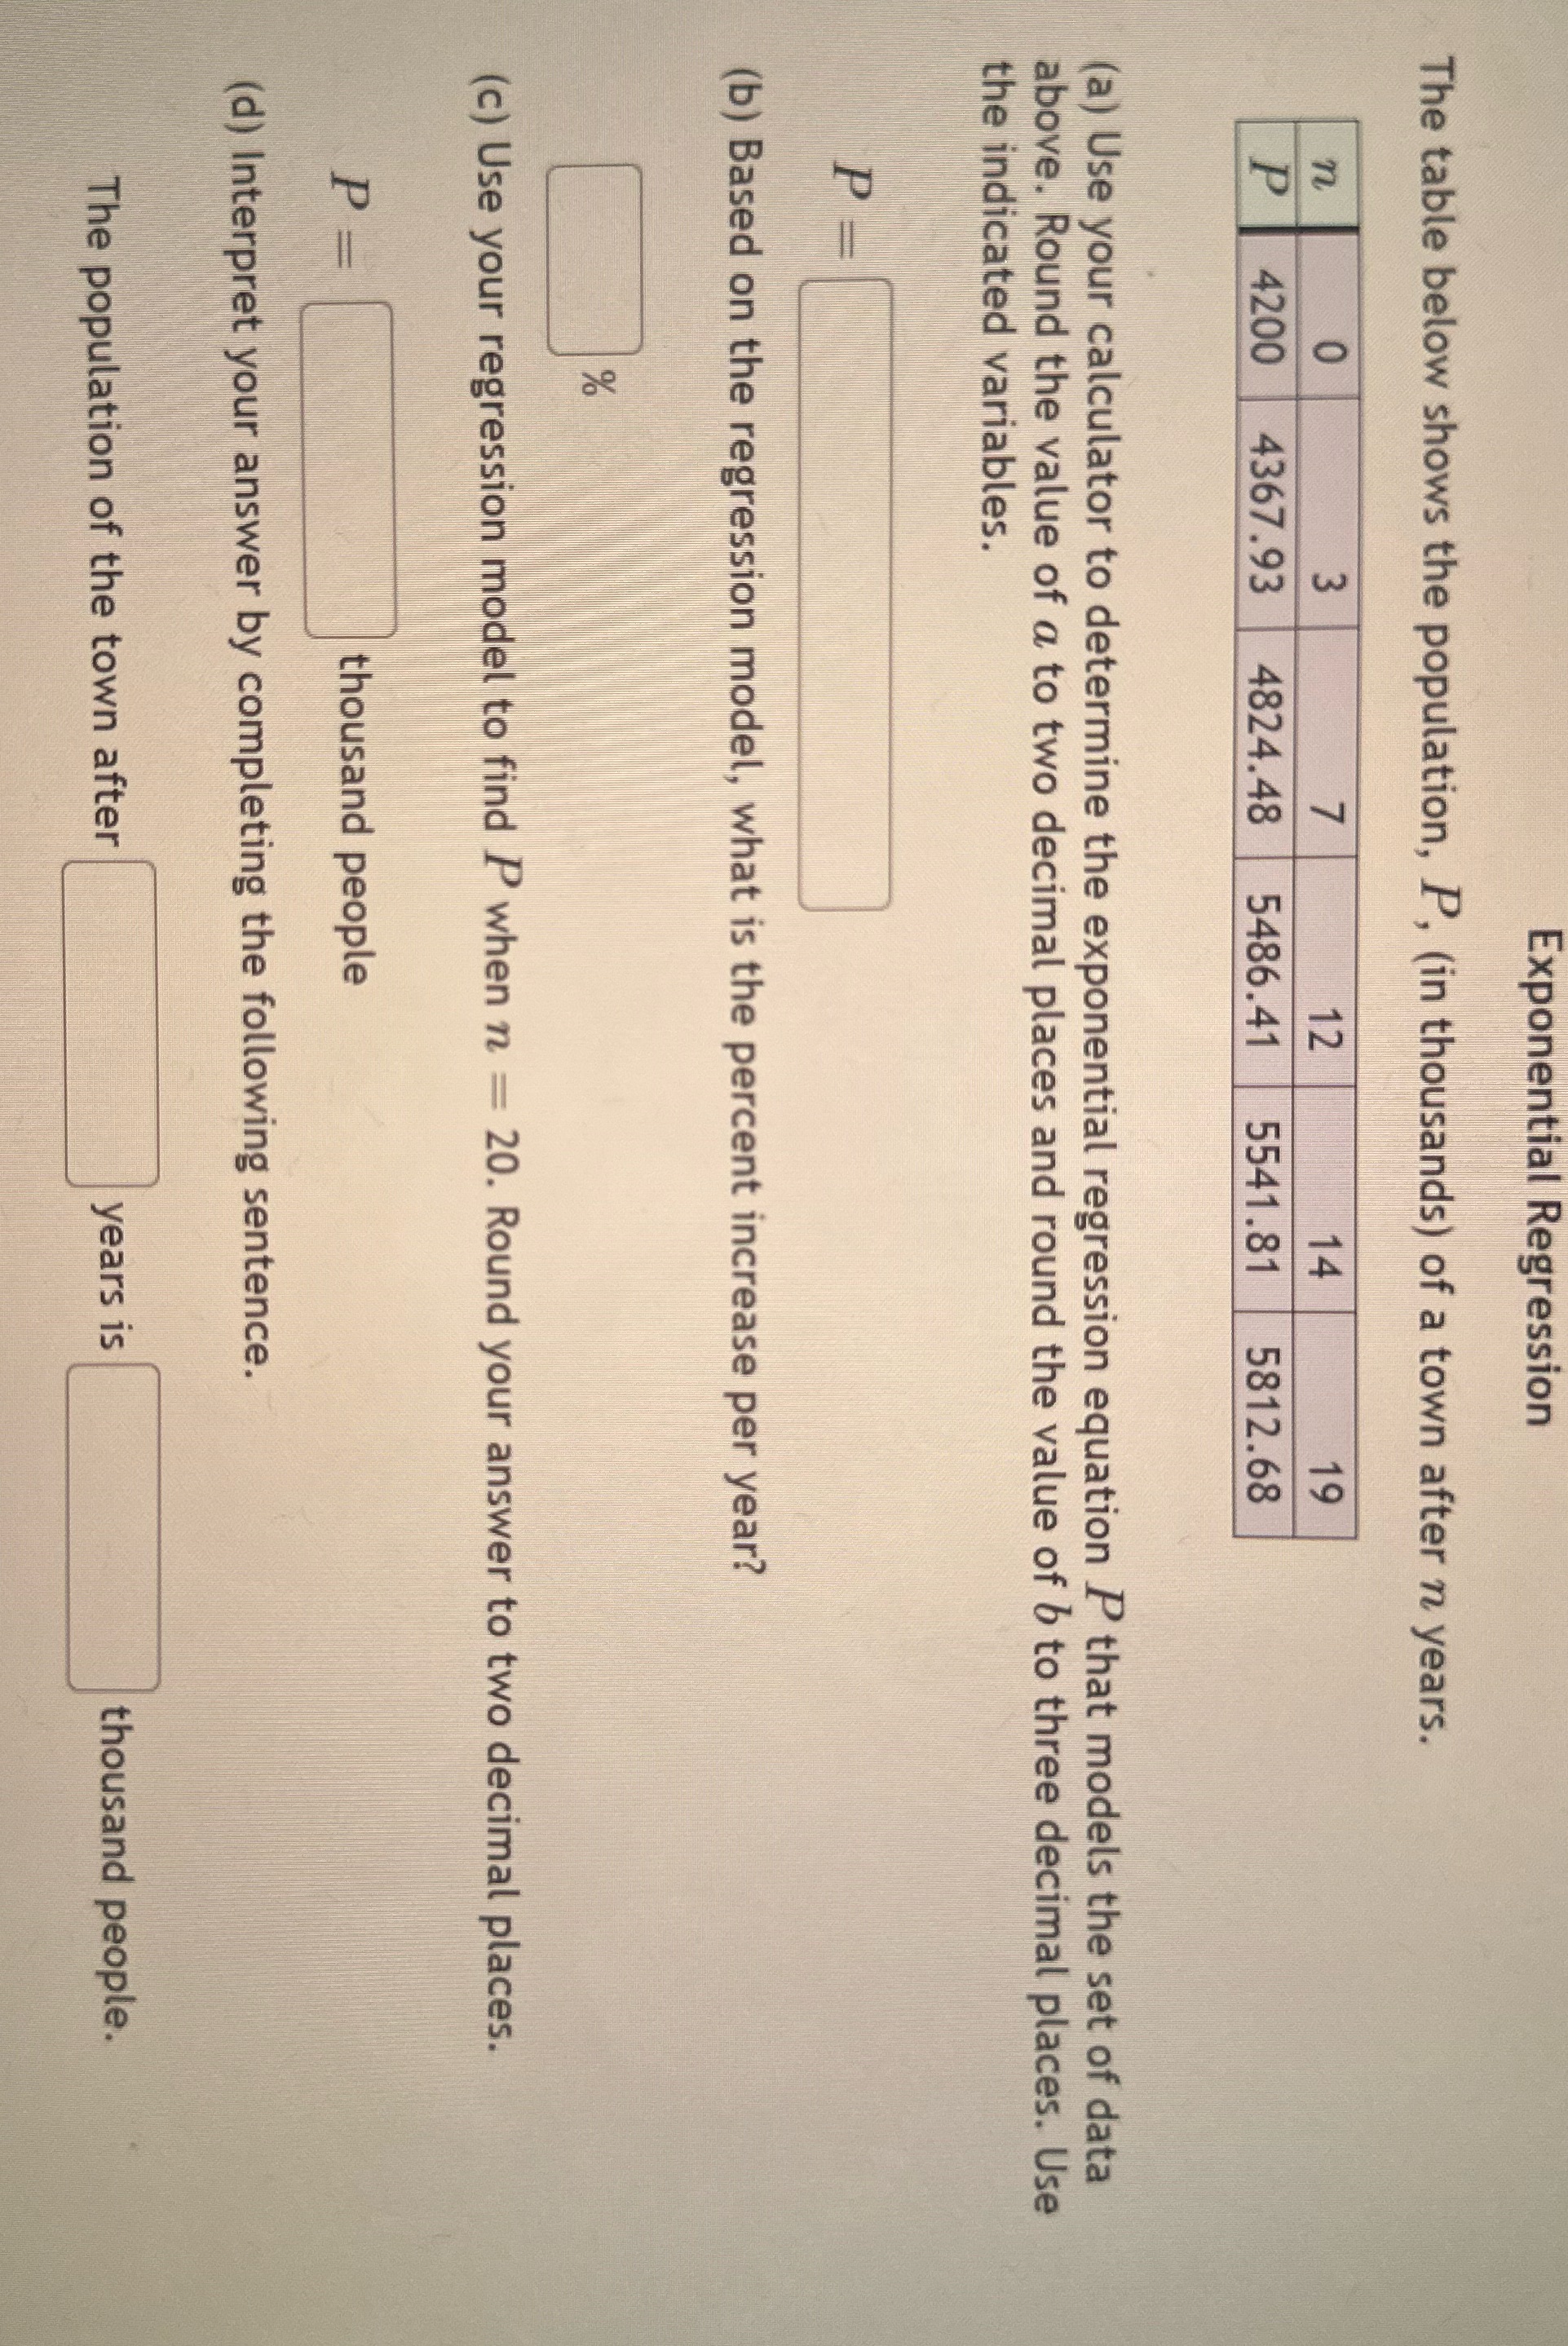
Question: Exponential Regression The table below shows the population, P, (in thousands) of a town after n years. O m N 4200 4367.93 4824.48 5486.41 5541.81

Exponential Regression The table below shows the
Exponential Regression The table below shows the population, P, (in thousands) of a town after n years. O m N 4200 4367.93 4824.48 5486.41 5541.81 5812.68 (a) Use your calculator to determine the exponential regression equation P that models the set of data above. Round the value of a to two decimal places and round the value of b to three decimal places. Use the indicated variables. (b) Based on the regression model, what is the percent increase per year? (c) Use your regression model to find P when n = 20. Round your answer to two decimal places. thousand people (d) Interpret your answer by completing the following sentence. The population of the town after years is thousand people

Step by Step Solution

There are 3 Steps involved in it

1 Expert Approved Answer
Step: 1 Unlock blur-text-image
Question Has Been Solved by an Expert!

Get step-by-step solutions from verified subject matter experts

Step: 2 Unlock
Step: 3 Unlock

Students Have Also Explored These Related Mathematics Questions!