

Question: Express the graph shown in color using interval notation. Also express it as an inequality involving x. -2 -1 2 3 6 9 10 Use

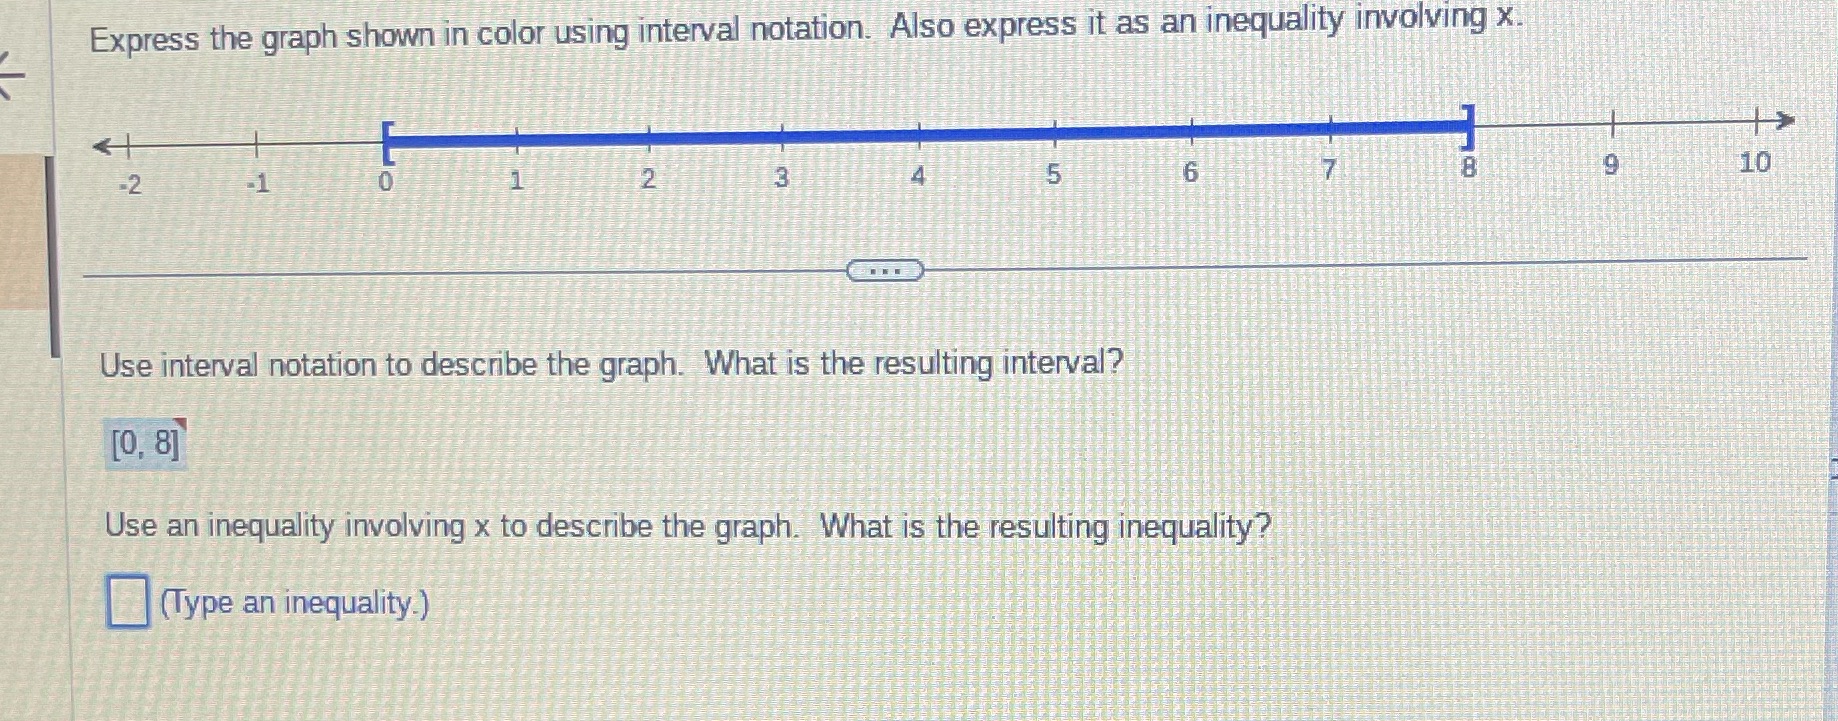
Express the graph shown in color using interval notation. Also express it as an inequality involving x. -2 -1 2 3 6 9 10 Use interval notation to describe the graph. What is the resulting interval? [0, 8] Use an inequality involving x to describe the graph. What is the resulting inequality? (Type an inequality.)
Step by Step Solution
There are 3 Steps involved in it
1 Expert Approved Answer
Step: 1 Unlock

Question Has Been Solved by an Expert!
Get step-by-step solutions from verified subject matter experts
Step: 2 Unlock
Step: 3 Unlock