

Question: EXTENDED ANALYSIS A2 AA 2-3 Key comparative figures for Apple, Google, and Samsung follow. $ millions Total liabilities Total assets Samsung Apple Google Current
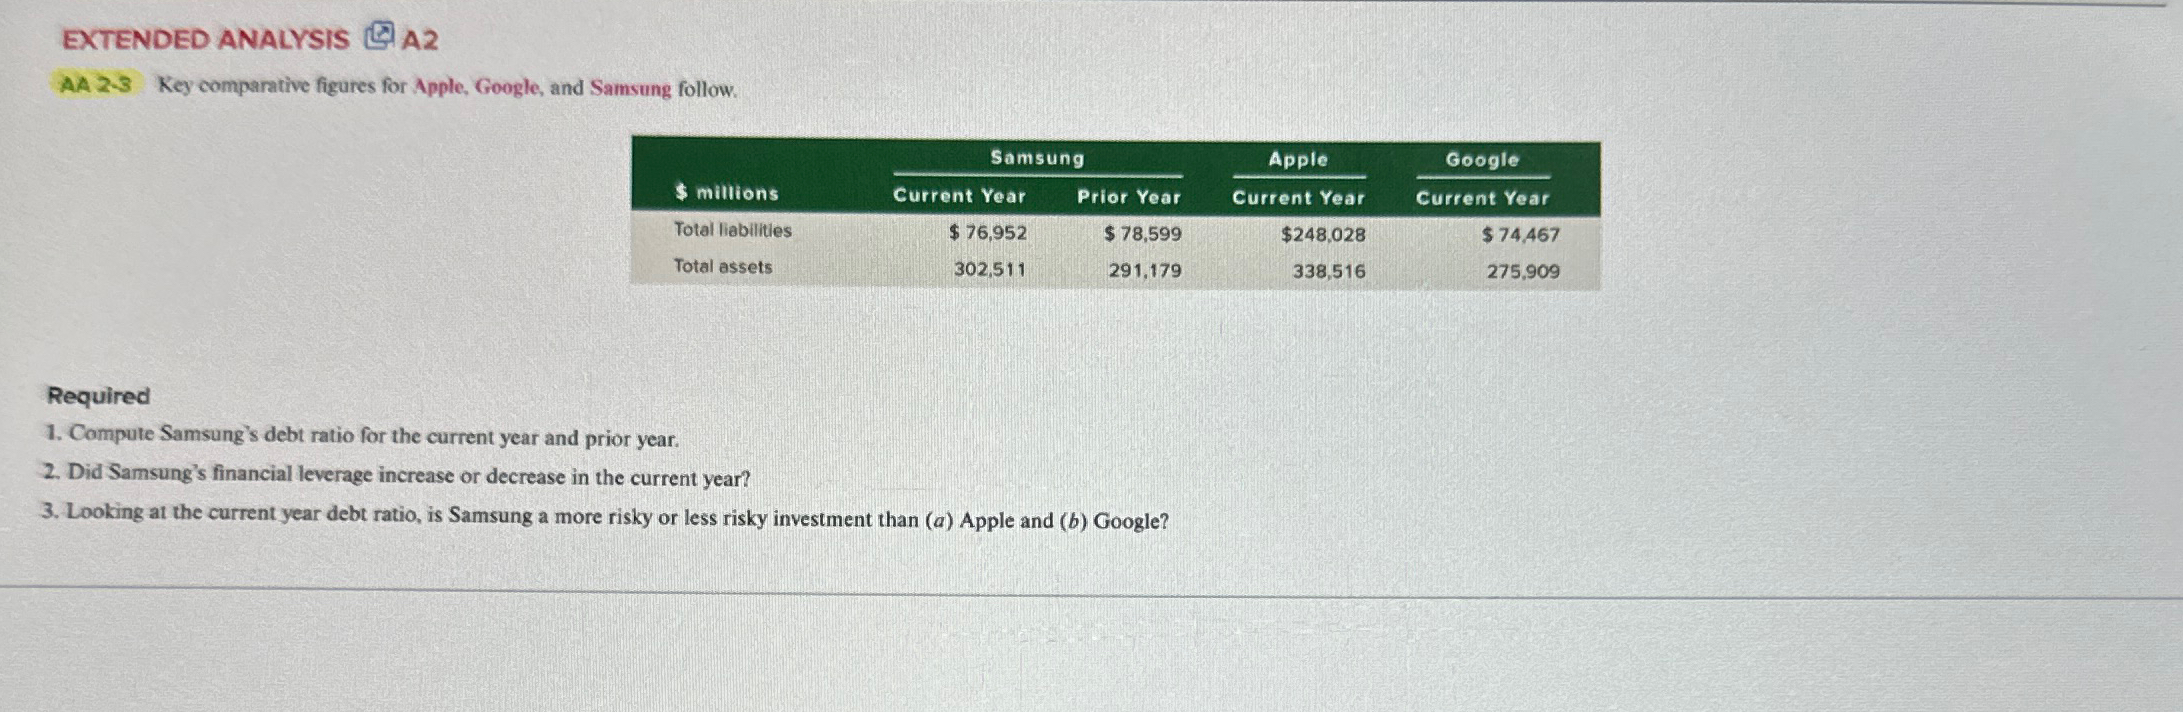
EXTENDED ANALYSIS A2 AA 2-3 Key comparative figures for Apple, Google, and Samsung follow. $ millions Total liabilities Total assets Samsung Apple Google Current Year $ 76,952 Prior Year $ 78,599 Current Year $248,028 Current Year $74,467 302,511 291,179 338,516 275,909 Required 1. Compute Samsung's debt ratio for the current year and prior year. 2. Did Samsung's financial leverage increase or decrease in the current year? 3. Looking at the current year debt ratio, is Samsung a more risky or less risky investment than (a) Apple and (b) Google?
Step by Step Solution
There are 3 Steps involved in it
1 Expert Approved Answer
Step: 1 Unlock

Question Has Been Solved by an Expert!
Get step-by-step solutions from verified subject matter experts
Step: 2 Unlock
Step: 3 Unlock