

Question: ExtraCredit-09: Problem 2 Problem Value: 1 point(s). Problem Score: 62%. Attempts Remaining: Unlimited. (1 point) Honeybee colonies ~ From 1995 to 2012, researchers surveyed the
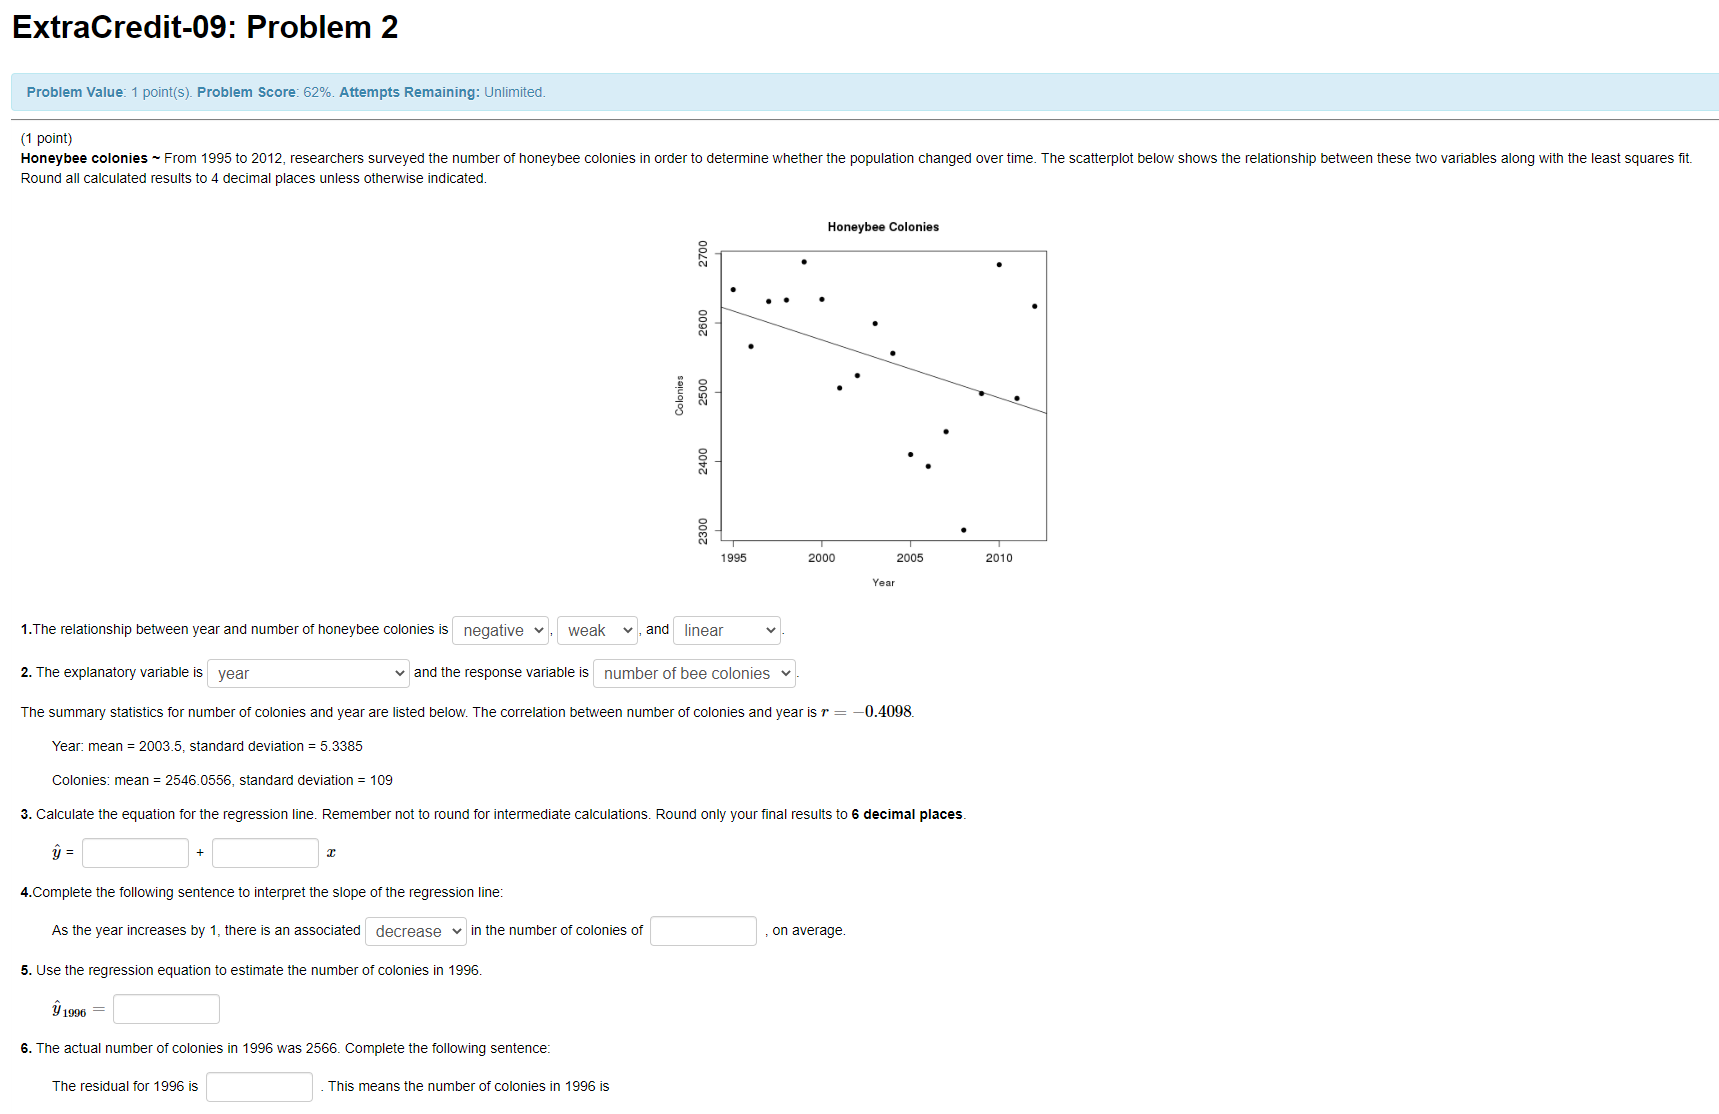
ExtraCredit-09: Problem 2 Problem Value: 1 point(s). Problem Score: 62%. Attempts Remaining: Unlimited. (1 point) Honeybee colonies ~ From 1995 to 2012, researchers surveyed the number of honeybee colonies in order to determine whether the population changed over time. The scatterplot below shows the relationship between these two variables along with the least squares fit. Round all calculated results to 4 decimal places unless otherwise indicated. Honeybee Colonies 2700 2600 2500 Colonies 2400 2300 1995 2000 2005 2010 Year 1. The relationship between year and number of honeybee colonies is negative , weak , and linear 2. The explanatory variable is year and the response variable is number of bee colonies The summary statistics for number of colonies and year are listed below. The correlation between number of colonies and year is r = -0.4098. Year: mean = 2003.5, standard deviation = 5.3385 Colonies: mean = 2546.0556, standard deviation = 109 3. Calculate the equation for the regression line. Remember not to round for intermediate calculations. Round only your final results to 6 decimal places. y = 4.Complete the following sentence to interpret the slope of the regression line: As the year increases by 1, there is an associated decrease | in the number of colonies of on average. 5. Use the regression equation to estimate the number of colonies in 1996 y 1996 = 6. The actual number of colonies in 1996 was 2566. Complete the following sentence. The residual for 1996 is This means the number of colonies in 1996 is
Step by Step Solution
There are 3 Steps involved in it

Get step-by-step solutions from verified subject matter experts