

Question: ExxonMobil Explain why you think Chevron and shell are comparable to ExxonMobil. (Updated: Data uploaded) Do an earnings analysis of ExxonMobil, Chevron, and shell and
ExxonMobil Explain why you think Chevron and shell are comparable to ExxonMobil. (Updated: Data uploaded)
Do an earnings analysis of ExxonMobil, Chevron, and shell and Compare overtime ROE and ROA and their components
Compare ExxonMobil to Chevron and shell. Compare ROE and ROA current and over time
(in millions) 2012 2013 2014 2015 2016
Sales $451,509 $420,836 $349,105 $259,488 $218,608
Net Earnings $44,880 $ 32,580 $32,520 $16,150 $7,840
Assets $333,795 $346,808 $349,493 $336,758 $330,314
Equity $171,660 $180,495 $181,064 $176,810 $173,830
Growth (in percent) 2012 2013 2014 2015 2016 Avg
Sales -.068 -.170 -.257 -.158 -.163
Net Earnings -.274 -.002 -.503 -.515 -.324
Assets .039 .008 -.036 -.019 -.002
Equity .051 .003 -.023 -.017 .004
2012 2013 2014 2015 2016
Return on Equity .261 .181 .180 .091 .045
Return on Sales .099 .077 .093 .062 .036
Asset Turnover 1.352 1.213 .9988 .7705 .6557
Leverage 1.945 1.921 1.930 1.905 1.900
Market ROE ROS Sales/ Assets/
2016 Cap Assets Equity
ExxonMobil 376.31 .045 .036 .656 1.900
Chervon 223.17 -.003 -.005 .424 1.787
Shell 185.27 -.007 -.006 .568 2.204 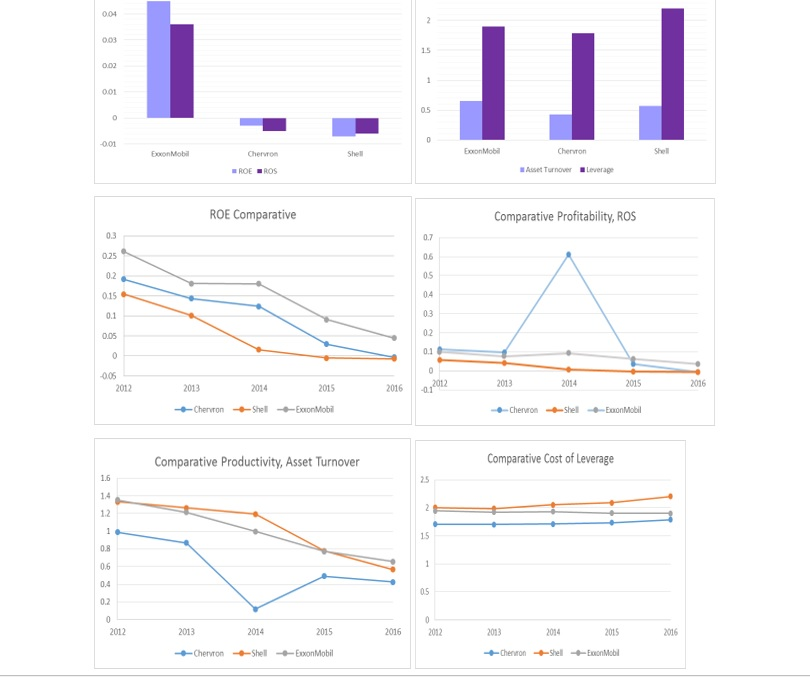
001 Asset Turnover Leverage ROE Comparative Comparative Profitability, ROS 0.3 0.25 0.2 0.7 0S 04 0.3 02 0.1 0.05 -005 2012 2013 204 215 2016001 2014 2015206 Comparative Productivity, Asset Turnover Comparative Cost of Leverage 1.6 14 1.2 15 05 2013 2014 2016 201 2015 2013 2014 2015 2016 ChervronShellExxonMobil
Step by Step Solution
There are 3 Steps involved in it

Get step-by-step solutions from verified subject matter experts