

Question: A B C D All the following are true relative to a Histogram EXCEPT which one? The graphical summary can be prepared for data
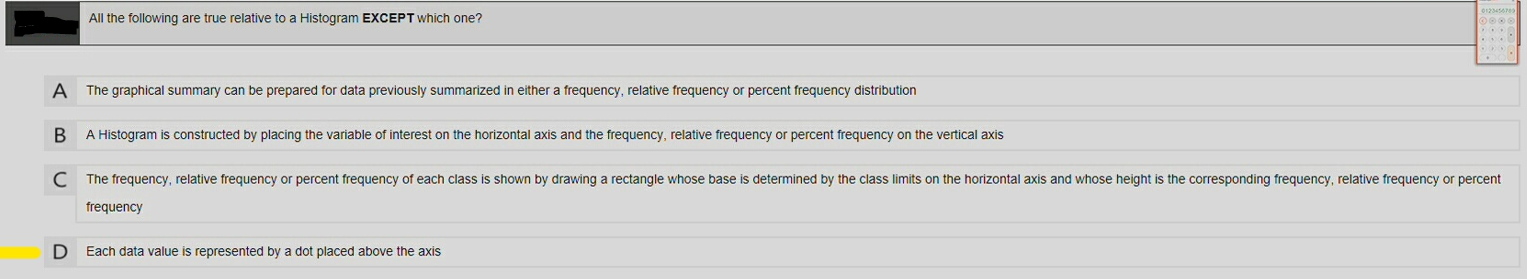

A B C D All the following are true relative to a Histogram EXCEPT which one? The graphical summary can be prepared for data previously summarized in either a trequency, relative frequency or percent frequency distribution A Histogram is constructed by placing the variable of interest on the horizontal axis and the frequency, relative frequency or percent frequency on the vertical axis The frequency, relative frequency or percent frequency or each class is shown by drawing a rectangle whose base is determined by the class limits on the horizontal axis and whose height is the corresponding frequency, relative frequency or percent frequency Each data value is represented by a dot placed above the axis
Step by Step Solution
There are 3 Steps involved in it

Get step-by-step solutions from verified subject matter experts