

Question: Question 2 The table below shows the weekly demand for camera in one particular market along with the corresponding price. Demand, x Price, y
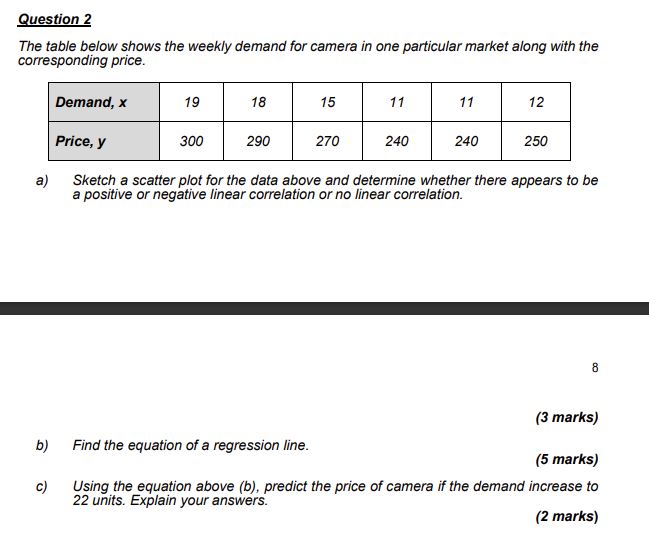

Question 2 The table below shows the weekly demand for camera in one particular market along with the corresponding price. Demand, x Price, y 19 18 290 15 270 11 11 240 12 250 a) b) c) Sketch a scatter plot for the data above and determine whether there appears to be a positive or negative linear correlation or no linear correlation (3 marks) Find the equation of a regression line. (5 marks) Using the equation above (b), predict the price of camera if the demand increase to 22 units. Explain your answers. (2 marks)
Step by Step Solution
There are 3 Steps involved in it
1 Expert Approved Answer
Step: 1 Unlock

Question Has Been Solved by an Expert!
Get step-by-step solutions from verified subject matter experts
Step: 2 Unlock
Step: 3 Unlock