

Question: The following graph displays isoquants for varying amounts of capital and labor. Capital (K) 1,000 100 10 10 100 1,000 Labor (L) If the
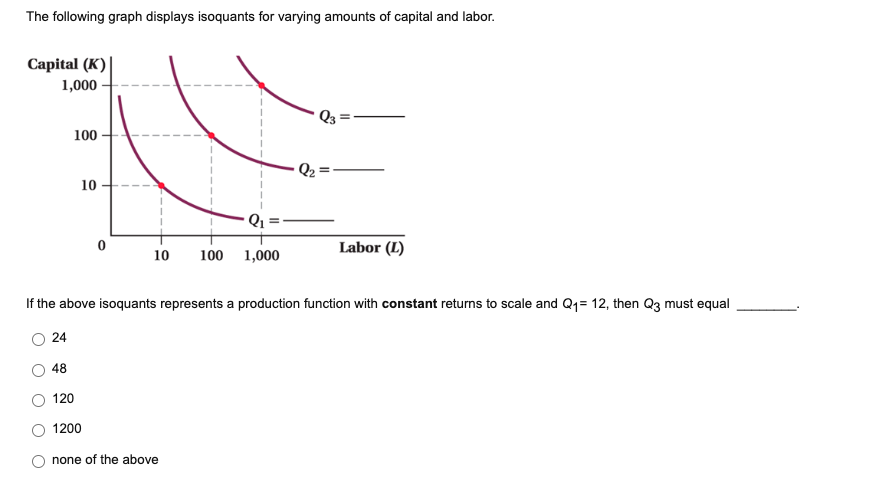

The following graph displays isoquants for varying amounts of capital and labor. Capital (K) 1,000 100 10 10 100 1,000 Labor (L) If the above isoquants represents a production function with constant retums to scale and QI = 1 2, then Q3 must equal 48 120 1200 none of the above
Step by Step Solution
There are 3 Steps involved in it
1 Expert Approved Answer
Step: 1 Unlock

Question Has Been Solved by an Expert!
Get step-by-step solutions from verified subject matter experts
Step: 2 Unlock
Step: 3 Unlock