

Question: The diagram below illustrates a consumer's demand Curve for snickers. If the price Of snickers falls from $30 to $20, but the consumer is

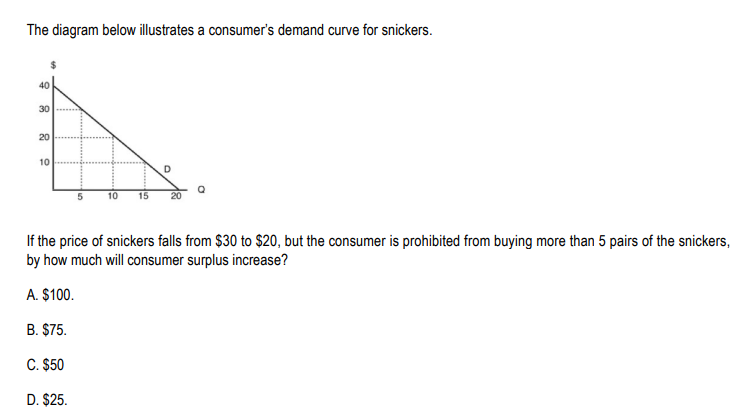
The diagram below illustrates a consumer's demand Curve for snickers. If the price Of snickers falls from $30 to $20, but the consumer is prohibited from buying more than 5 pairs Of the snickers, by how much will consumer surplus increase? A. $100. B. $75. c. $50 D. $25.
Step by Step Solution
There are 3 Steps involved in it
1 Expert Approved Answer
Step: 1 Unlock

Question Has Been Solved by an Expert!
Get step-by-step solutions from verified subject matter experts
Step: 2 Unlock
Step: 3 Unlock