

Question: 10. (4 points) On the plot provided, graph the parabola described by the equation (x + I). 5 I l. (4 points) Graph the

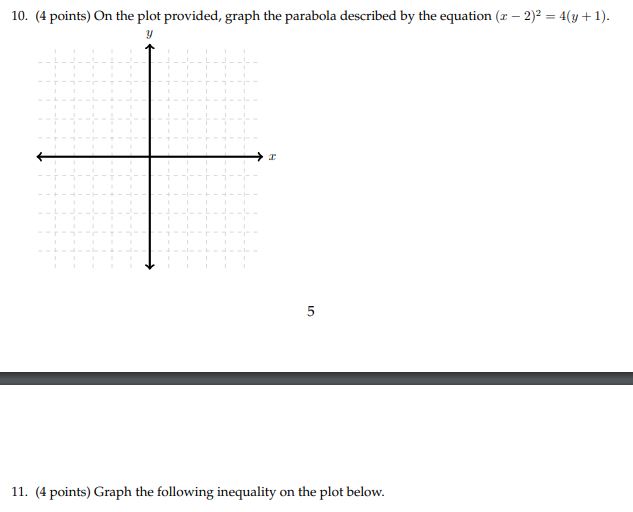
10. (4 points) On the plot provided, graph the parabola described by the equation (x + I). 5 I l. (4 points) Graph the following inequality on the plot below.
Step by Step Solution
There are 3 Steps involved in it
1 Expert Approved Answer
Step: 1 Unlock

Question Has Been Solved by an Expert!
Get step-by-step solutions from verified subject matter experts
Step: 2 Unlock
Step: 3 Unlock