

Question: Construct a scatterplot for the given data. x 0.33 0.92 0.36 0.29 y 0.5 0.49 0.08 0.27 _0.09 0.13 0.97 0.44 0.39 0.95 0.3
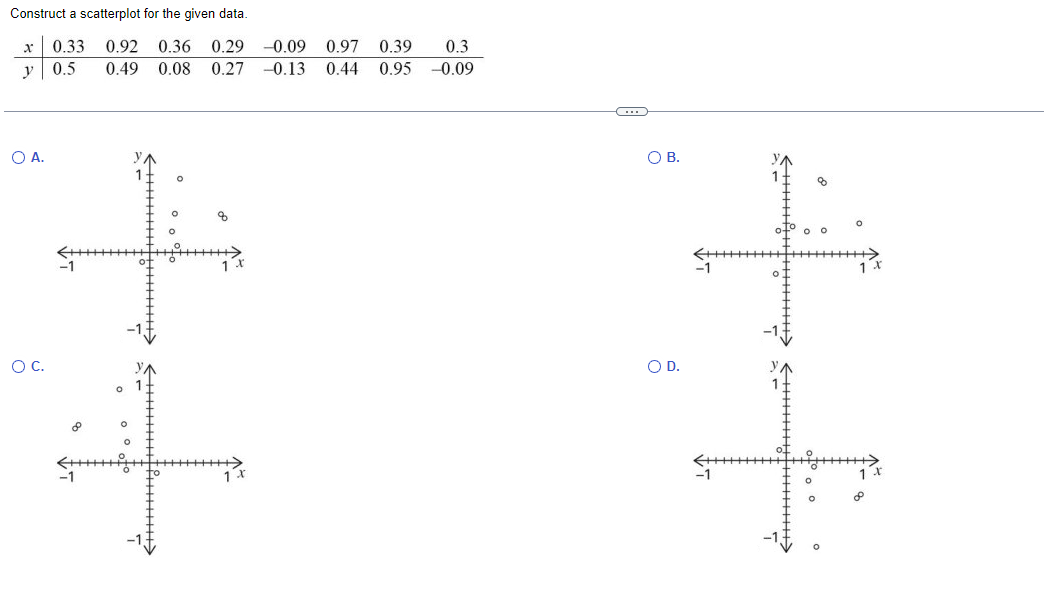

Construct a scatterplot for the given data. x 0.33 0.92 0.36 0.29 y 0.5 0.49 0.08 0.27 _0.09 0.13 0.97 0.44 0.39 0.95 0.3 0.09
Step by Step Solution
There are 3 Steps involved in it
1 Expert Approved Answer
Step: 1 Unlock

Question Has Been Solved by an Expert!
Get step-by-step solutions from verified subject matter experts
Step: 2 Unlock
Step: 3 Unlock