

Question: 6 s 9 10 n 12 n 14 15 16 17 18 19 20 data Based on the boxplot above, identify the the following
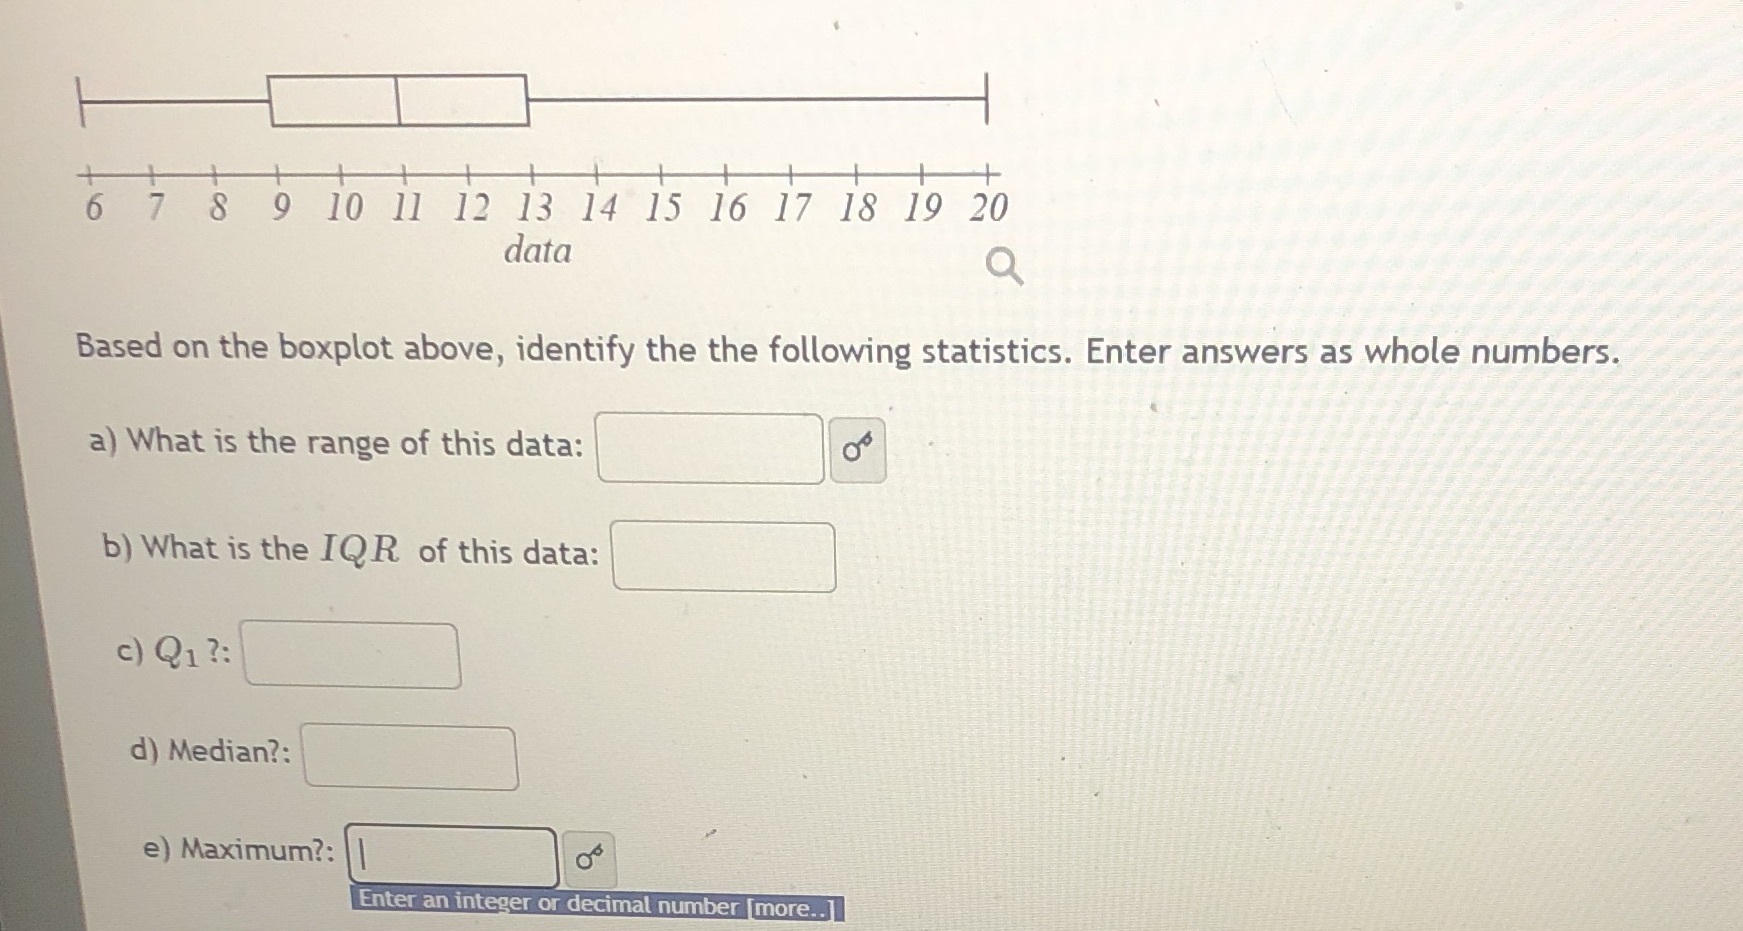

6 s 9 10 n 12 n 14 15 16 17 18 19 20 data Based on the boxplot above, identify the the following statistics. Enter answers as whole numbers. a) What is the range of this data: b) What is the IQR of this data: C) QI d) Median?. e) Mvaximum?: Enter an integer or decimat number more..
Step by Step Solution
There are 3 Steps involved in it
1 Expert Approved Answer
Step: 1 Unlock

Question Has Been Solved by an Expert!
Get step-by-step solutions from verified subject matter experts
Step: 2 Unlock
Step: 3 Unlock