

Question: Price of Ice-Cream Cone Change in Supply Decrease in Supply Increase in Supply Quantity of Ice-Cream Cones (3) This graph shows that at a
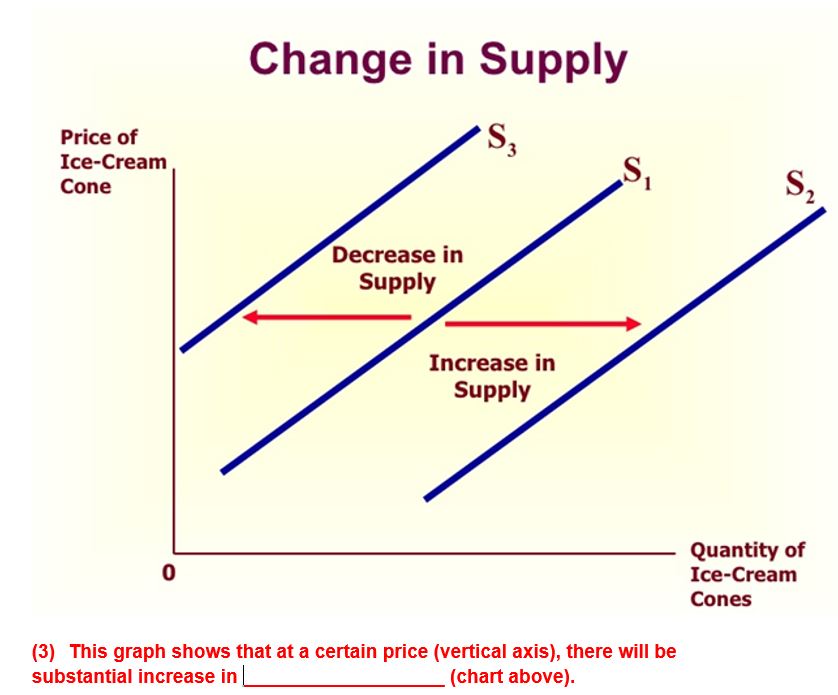
Price of Ice-Cream Cone Change in Supply Decrease in Supply Increase in Supply Quantity of Ice-Cream Cones (3) This graph shows that at a certain price (vertical axis), there will be substantial increase in (chart above).
Step by Step Solution
There are 3 Steps involved in it
1 Expert Approved Answer
Step: 1 Unlock

Question Has Been Solved by an Expert!
Get step-by-step solutions from verified subject matter experts
Step: 2 Unlock
Step: 3 Unlock