

Question: Activity 10_2: Comparing Frequency Polygons we xant to compare or more groups on some measurement. One way to do this effectively to use frequency
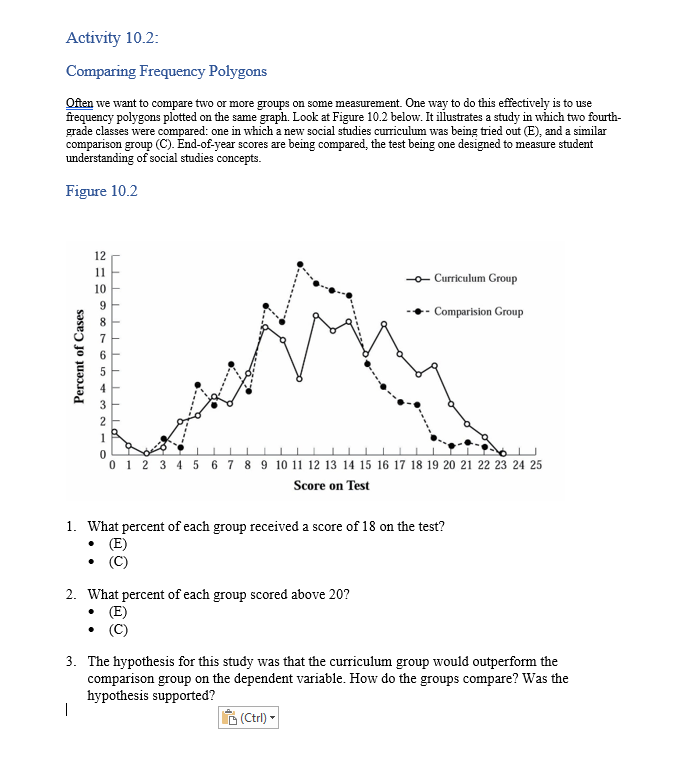
Activity 10_2: Comparing Frequency Polygons we xant to compare or more groups on some measurement. One way to do this effectively to use frequency polygons plotted on dae mne graph Look at Figure 10.2 belouz It illutrates a study in which two foulth- grade clases were compared: one m %hich a new ocial studies curriculum was being fried out and a similar companon group scores are bemg compared, the test bemg one designed to measure student understanding of social studies concepts _ Figure 10.2 11 10 012 345 Curriculum Croup - Comparision Group 67 8 9 10 11 12 13 14 15 16 17 18 2223 24 25 Score on Test What percent of each group received a score of 18 on the test? What percent of each group scored above 20? The hypothesis for this study was that the curriculum group would outperform the comparison group on the dependent variable. How do the groups compare? Was the hypothesis supported? (Ctrl)
Step by Step Solution
There are 3 Steps involved in it

Get step-by-step solutions from verified subject matter experts