

Question: Listed here, , is the 10-year, per-share performance record of Larry, Moe, & Curley's Growth Fund, as obtained from the fund's May 30, 2016,
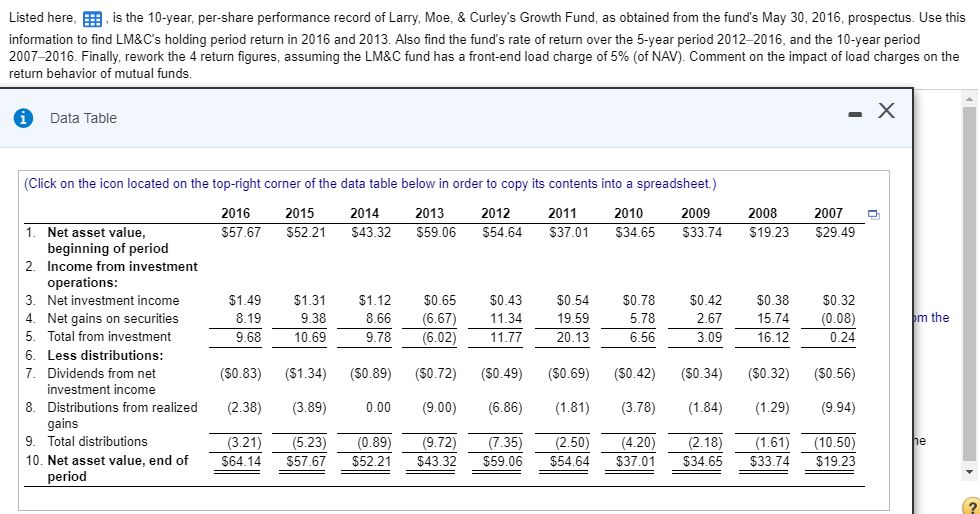
Listed here, , is the 10-year, per-share performance record of Larry, Moe, & Curley's Growth Fund, as obtained from the fund's May 30, 2016, prospectus. Use this information to find LM&Cs holding period return in 2016 and 2013. Also find the fund's rate of retum over the S-year period 20122016, and the 10-year period 20072016. Finally, rework the 4 return figures, assuming the LM&C fund has a front-end load charge of 5% (of NAV). Comment on the impact of load charges on the return behavior of mutual funds. O Data Table (Click on the icon located on the top-right corner of the data table below in order to copy its contents into a spreadsheet) Net asset value, beginning of period _ Income from investment operations: Net investment income 4. Net gains on securities Total from investment 6. Less distributions: Dividends from net investment income Distributions from realized gains Total distributions 10. Net asset value, end of period 2016 SS7_67 51.49 8.19 988 (SO .83) (2.38) (321) 2015 SS2_21 .31 9.38 1089 (Sl .34) (3 89) (523) SS7_67 2014 S43_32 $1.12 8_66 9.78 (SO .89) coo (0 89) $52 21 2013 sss_06 soss (687) (602) (SO.72) (900) (972) 2012 so_43 11_34 1177 (SO .49) (686) (786) 2011 S37_01 so_S4 19.59 20.13 (SO .69) (1.81) (280) 2010 S34_6S $0.78 6.78 686 (SO 42) (3 78) ($20) S3T01 2009 S33_74 so_42 2.67 3.09 (SO .34) (1.84) (218) $34 65 2008 S19_23 so_38 1574 16.12 (SO .32) (129) (1 61) $33.74 2007 S29_49 $0.32 (08) 0.24 (SO .56) (9.94) (1080) $19 23 the
Step by Step Solution
There are 3 Steps involved in it

Get step-by-step solutions from verified subject matter experts