

Question: The figure below shows the shares of global income received by the bottom 60% and top 10% of the world's population between 1820 and
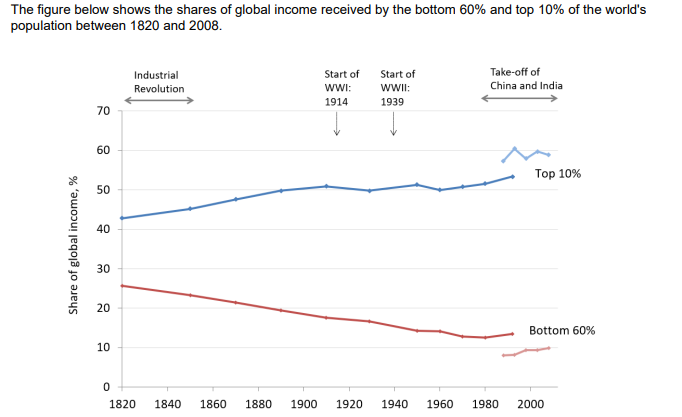
The figure below shows the shares of global income received by the bottom 60% and top 10% of the world's population between 1820 and 200B. China Industrial Revolution 1880 Start of 1914 1920 Start of vvwll; 191" 1940 Take-off of 20 10 1820 1840 1860 1900 1960 1980 and India Top 10% Bottom 2000
Step by Step Solution
There are 3 Steps involved in it
1 Expert Approved Answer
Step: 1 Unlock

Question Has Been Solved by an Expert!
Get step-by-step solutions from verified subject matter experts
Step: 2 Unlock
Step: 3 Unlock