

Question: The figure to the right shows the results of a survey in which 1023 adults from Country A, 1024 adults from Country a, 1014
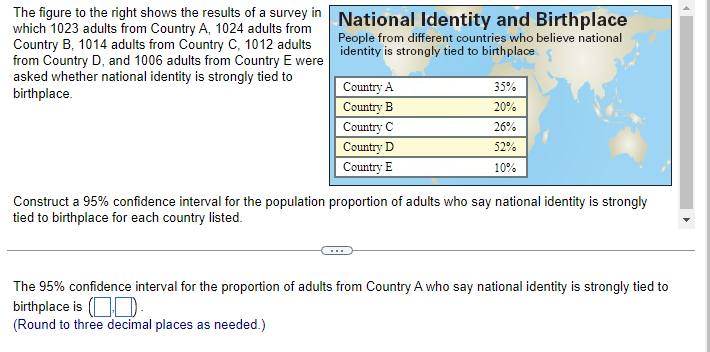
The figure to the right shows the results of a survey in which 1023 adults from Country A, 1024 adults from Country a, 1014 adults from Country C, 1012 adults from Country D, and 1006 adults from Country E were asked whether national identity is strongly tied to birthplace National Identity and Birthplace People from different countries who believe national identity is strongly tied to birthplace Countrv A Count-v B Count-v C Count-v D Countrv E Construct a 95% confidence interval for the population proportion of adults who say national identity is strongly tied to birthplace for each country listed. The 95% confidence interval for the proportion of adults from Country A who say national identity is strongly tied to birthplace is (Round to three decimal places as needed.)
Step by Step Solution
There are 3 Steps involved in it

Get step-by-step solutions from verified subject matter experts