

Question: The graph below depicts the velocity vs time graph for a spacecraft mission in our galaxy. Part I of the journey. labeled below, lasts
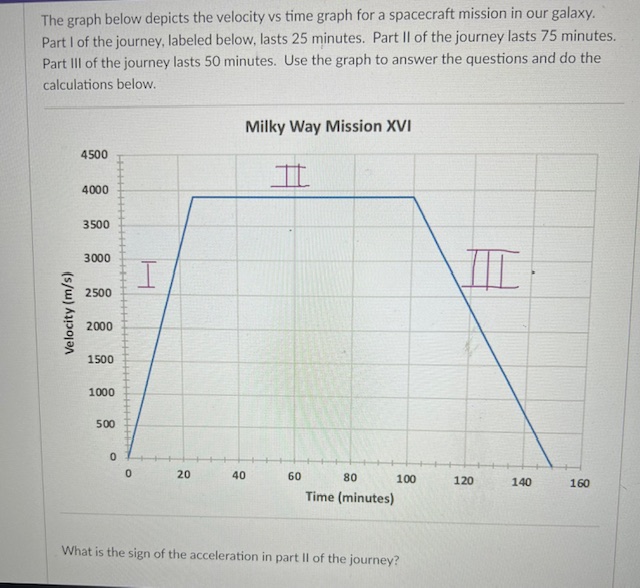
The graph below depicts the velocity vs time graph for a spacecraft mission in our galaxy. Part I of the journey. labeled below, lasts 25 minutes. Part II of the journey lasts 75 minutes. Part Ill of the journey lasts 50 minutes. Use the graph to answer the questions and do the calculations below. Milky Way Mission WI 4500 1 E 2500 Time (minutes) What is the sign of the acceleration in part II of the journey? _L_ 140
Step by Step Solution
There are 3 Steps involved in it
1 Expert Approved Answer
Step: 1 Unlock

Question Has Been Solved by an Expert!
Get step-by-step solutions from verified subject matter experts
Step: 2 Unlock
Step: 3 Unlock