

Question: 3. For problem 3, import the data in R from https : / [raw. githu busercontent. corn/hgweon2 /ss3859 / master /hw2-data-1. csv The data
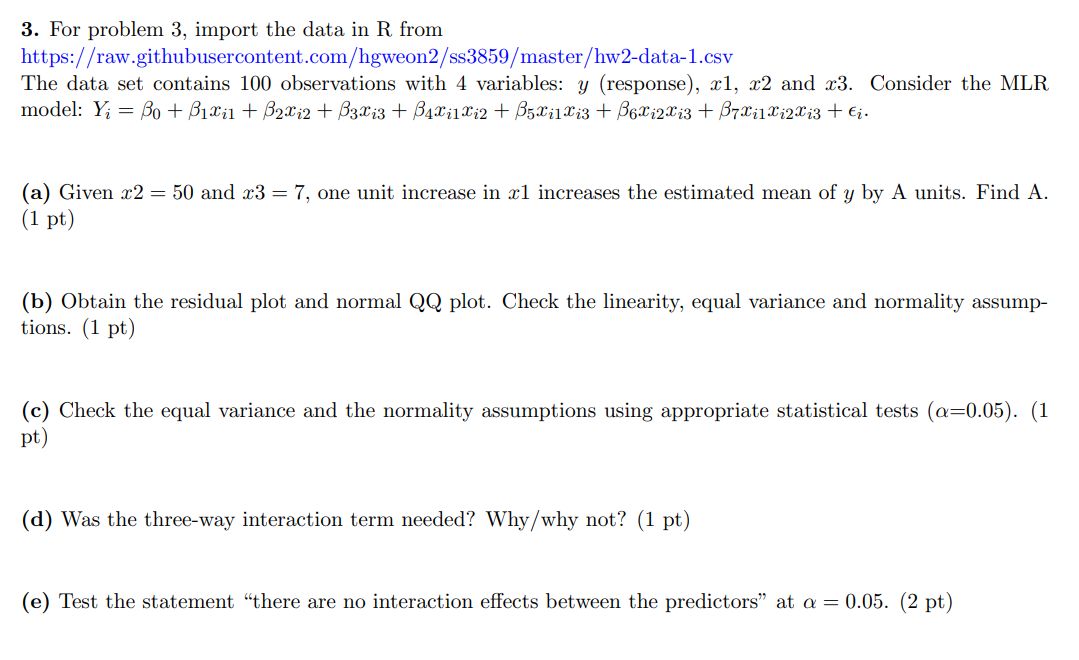
3. For problem 3, import the data in R from https : / [raw. githu busercontent. corn/hgweon2 /ss3859 / master /hw2-data-1. csv The data set contains 100 observations with 4 variables: y (response), :rl, and :r3. Consider the MLR model: Yi /30 4- 1Xi1 + 2Xi2 + 3Xi3 + 4Xi1Xi2 + 5Xi1Xi3 + 6Xi2Xi3 + 7Xi1Xi2Xi3 + Ei. (a) Given x'2 = 50 and x3 7, one unit increase in xl increases the estimated mean of y by A units. Find A. (1 pt) (b) Obtain the residual plot and normal QQ plot. Check the linearity, equal variance and normality assump- tions. (1 pt) (c) Check the equal variance and the normality assumptions using appropriate statistical tests (00.05). (1 pt) (d) Was the three-way interaction term needed? Why/why not? (1 pt) (e) Test the statement "there are no interaction effects between the predictors" at Q 0.05. (2 pt)
Step by Step Solution
There are 3 Steps involved in it

Get step-by-step solutions from verified subject matter experts