

Question: QUESTION 2 using the following data table ofthe average hours per week spent on Internet activities by 15- to IE-ye&ecICs far the years 1999-2008,
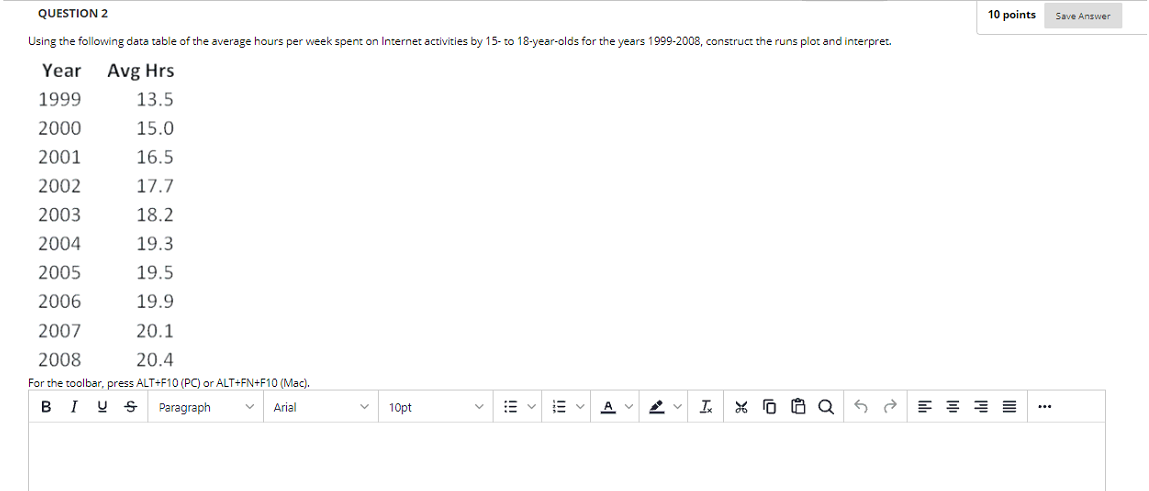
QUESTION 2 using the following data table ofthe average hours per week spent on Internet activities by 15- to IE-ye&ecICs far the years 1999-2008, construct the runs plot snd interpret. Year Avg Hrs 10 points Save 1999 2000 2001 2002 2003 2004 2005 2006 2007 2008 13.5 15.0 16.5 17.7 18.2 19.3 19.5 19.9 20.1 20.4 For the toolbar, press ALT+FIO (PC) or ALT+FN+FIO B I -9 Paragraph Ariel 1 Opt
Step by Step Solution
There are 3 Steps involved in it
1 Expert Approved Answer
Step: 1 Unlock

Question Has Been Solved by an Expert!
Get step-by-step solutions from verified subject matter experts
Step: 2 Unlock
Step: 3 Unlock