

Question: GDP end PCE inflation table 1974-04-01 1974-07-01 1974-10-01 1975-01-01 1975-04-01 1975-07-01 1975-10-01 1976-01-01 1976-04-01 1976-07-01 1976-10-01 1977-01-01 1977-04-01 1977-07-01 1977-10-01 1978-01-01 1978-04-01 1978-07-01 1978-10-01
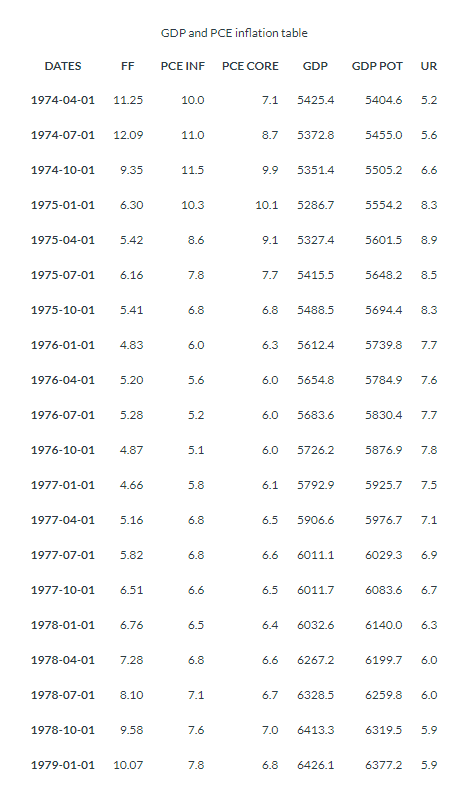
GDP end PCE inflation table 1974-04-01 1974-07-01 1974-10-01 1975-01-01 1975-04-01 1975-07-01 1975-10-01 1976-01-01 1976-04-01 1976-07-01 1976-10-01 1977-01-01 1977-04-01 1977-07-01 1977-10-01 1978-01-01 1978-04-01 1978-07-01 1978-10-01 1979-01-01 11.25 1209 9.35 5.42 616 5.41 4.83 5.28 4.87 4.66 5.16 5.82 651 676 7.28 & 10 9.58 10.07 PCE INF 11.0 11.5 PCE CORE 7.1 9.9 10.1 9.1 7.7 68 63 60 60 60 61 65 66 65 64 66 67 7.0 68 GDP 5425 _ 4 53728 5351.4 52867 5327.4 5415.5 5488.5 56124 5654.8 56836 57262 57929 59066 6011.1 6011.7 60326 6267.2 6328.5 64133 64261 GDP POT 5404.6 5455.0 5505.2 5554.2 5601.5 5648.2 5694.4 5739.8 5784.9 58304 58769 5925.7 59767 6029.3 60836 6140.0 6199.7 6259.8 6319.5 6377.2 UR 5.2 5.6 66 8.3 8.5 8.3 7.7 7.6 7.7 7.8 7.5 7.1 69 67 63 60 60 5.9 5.9
Step by Step Solution
There are 3 Steps involved in it

Get step-by-step solutions from verified subject matter experts