

Question: FIGURE 16.1 price level (GDP price index, 2009 = 100) Potential GDP 120 110 IOO 14 15 16 AS 17 18 Real GDP (trillions
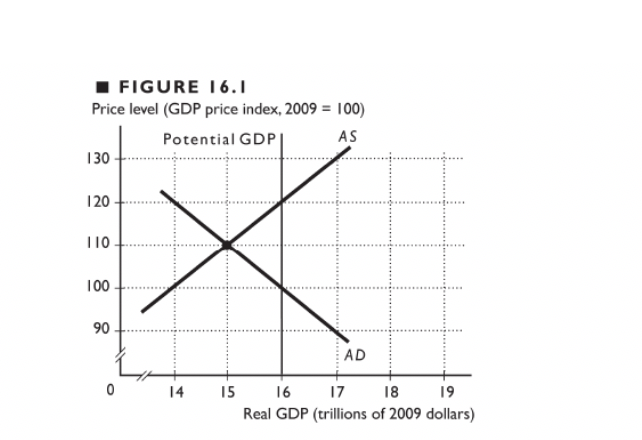
FIGURE 16.1 price level (GDP price index, 2009 = 100) Potential GDP 120 110 IOO 14 15 16 AS 17 18 Real GDP (trillions of 2009 dollars)
Step by Step Solution
There are 3 Steps involved in it
1 Expert Approved Answer
Step: 1 Unlock

Question Has Been Solved by an Expert!
Get step-by-step solutions from verified subject matter experts
Step: 2 Unlock
Step: 3 Unlock