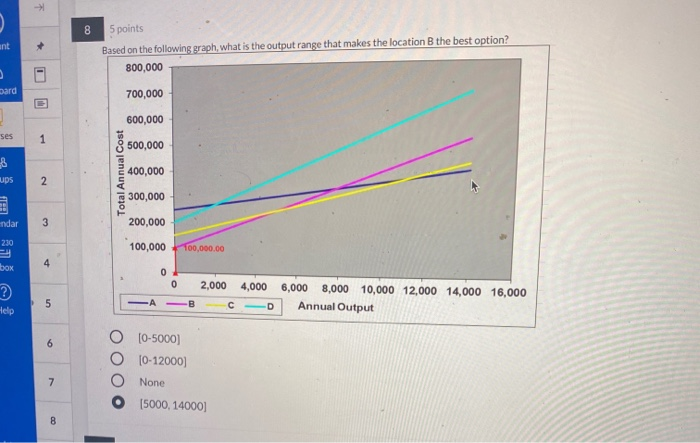
Question: F 8 ant + 5 points Based on the following graph, what is the output range that makes the location B the best option? 800,000

F 8 ant + 5 points Based on the following graph,
F 8 ant + 5 points Based on the following graph, what is the output range that makes the location B the best option? 800,000 3 bard 700,000 . 600,000 ses 1 500,000 8 Total Annual Cost 400,000 ups 2 300,000 ndar 3 200,000 230 100,000 100,000.00 box 4 0 0 2,000 4,000 6,000 8,000 10,000 12,000 14,000 16,000 Annual Output 5 B Help D 6 O (0-5000] [0-12000) None O (5000, 14000] 7 8 7 5 points Copy of If you need to produce 8,000 units of output, based on the following graph, which location would you select? 800,000 700,000 600,000 8 500,000 Total Annual Cost 400,000 300,000 200,000 100,000 100,000.00 0 0 2,000 4,000 D 6,000 8,000 10,000 12,000 14,000 16,000 Annual Output A 5 7 D OOO B 8 A

Step by Step Solution

There are 3 Steps involved in it

1 Expert Approved Answer
Step: 1 Unlock blur-text-image
Question Has Been Solved by an Expert!

Get step-by-step solutions from verified subject matter experts

Step: 2 Unlock
Step: 3 Unlock

Students Have Also Explored These Related General Management Questions!