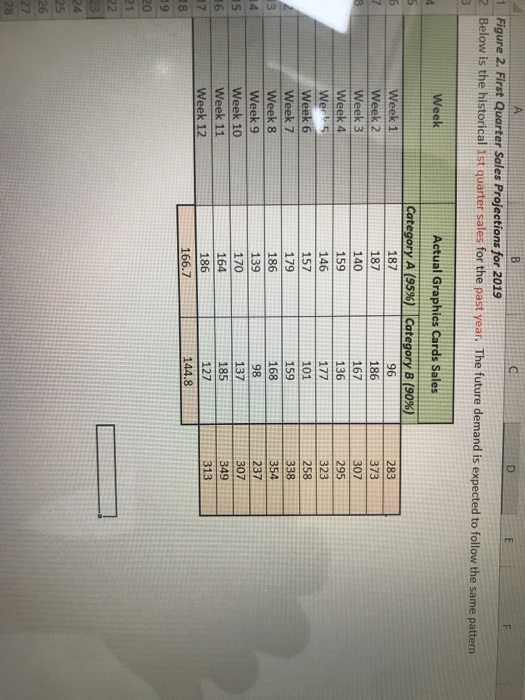
Question: F A B D E 1 Figure 2. First Quarter Sales Projections for 2019 2 Below is the historical ist quarter sales for the past

F A B D E 1 Figure 2. First Quarter Sales
F A B D E 1 Figure 2. First Quarter Sales Projections for 2019 2 Below is the historical ist quarter sales for the past year. The future demand is expected to follow the same pattern 3 Week Actual Graphics Cards Sales 4 5 6 7 8 Week 1 Week 2 Week 3 Week 4 Werts Week 6 Week 7 Week 8 Week 9 Week 10 Week 11 Week 12 Category A (95%) 187 187 140 159 146 157 179 186 139 170 164 186 166.7 Category B (90%) 96 186 167 136 177 101 159 168 98 137 185 127 144.8 283 373 307 295 323 258 338 354 237 307 349 313 13 14 15 16 17 18 19 21 22 23 25 26 27 28 F A B D E 1 Figure 2. First Quarter Sales Projections for 2019 2 Below is the historical ist quarter sales for the past year. The future demand is expected to follow the same pattern 3 Week Actual Graphics Cards Sales 4 5 6 7 8 Week 1 Week 2 Week 3 Week 4 Werts Week 6 Week 7 Week 8 Week 9 Week 10 Week 11 Week 12 Category A (95%) 187 187 140 159 146 157 179 186 139 170 164 186 166.7 Category B (90%) 96 186 167 136 177 101 159 168 98 137 185 127 144.8 283 373 307 295 323 258 338 354 237 307 349 313 13 14 15 16 17 18 19 21 22 23 25 26 27 28

Step by Step Solution

There are 3 Steps involved in it

1 Expert Approved Answer
Step: 1 Unlock blur-text-image
Question Has Been Solved by an Expert!

Get step-by-step solutions from verified subject matter experts

Step: 2 Unlock
Step: 3 Unlock

Students Have Also Explored These Related General Management Questions!