

Question: f) Draw a graph of the situation above that is similar to either Figure 9-9 (for a tariff) or Figure 9-11 (for a subsidy). Calculate
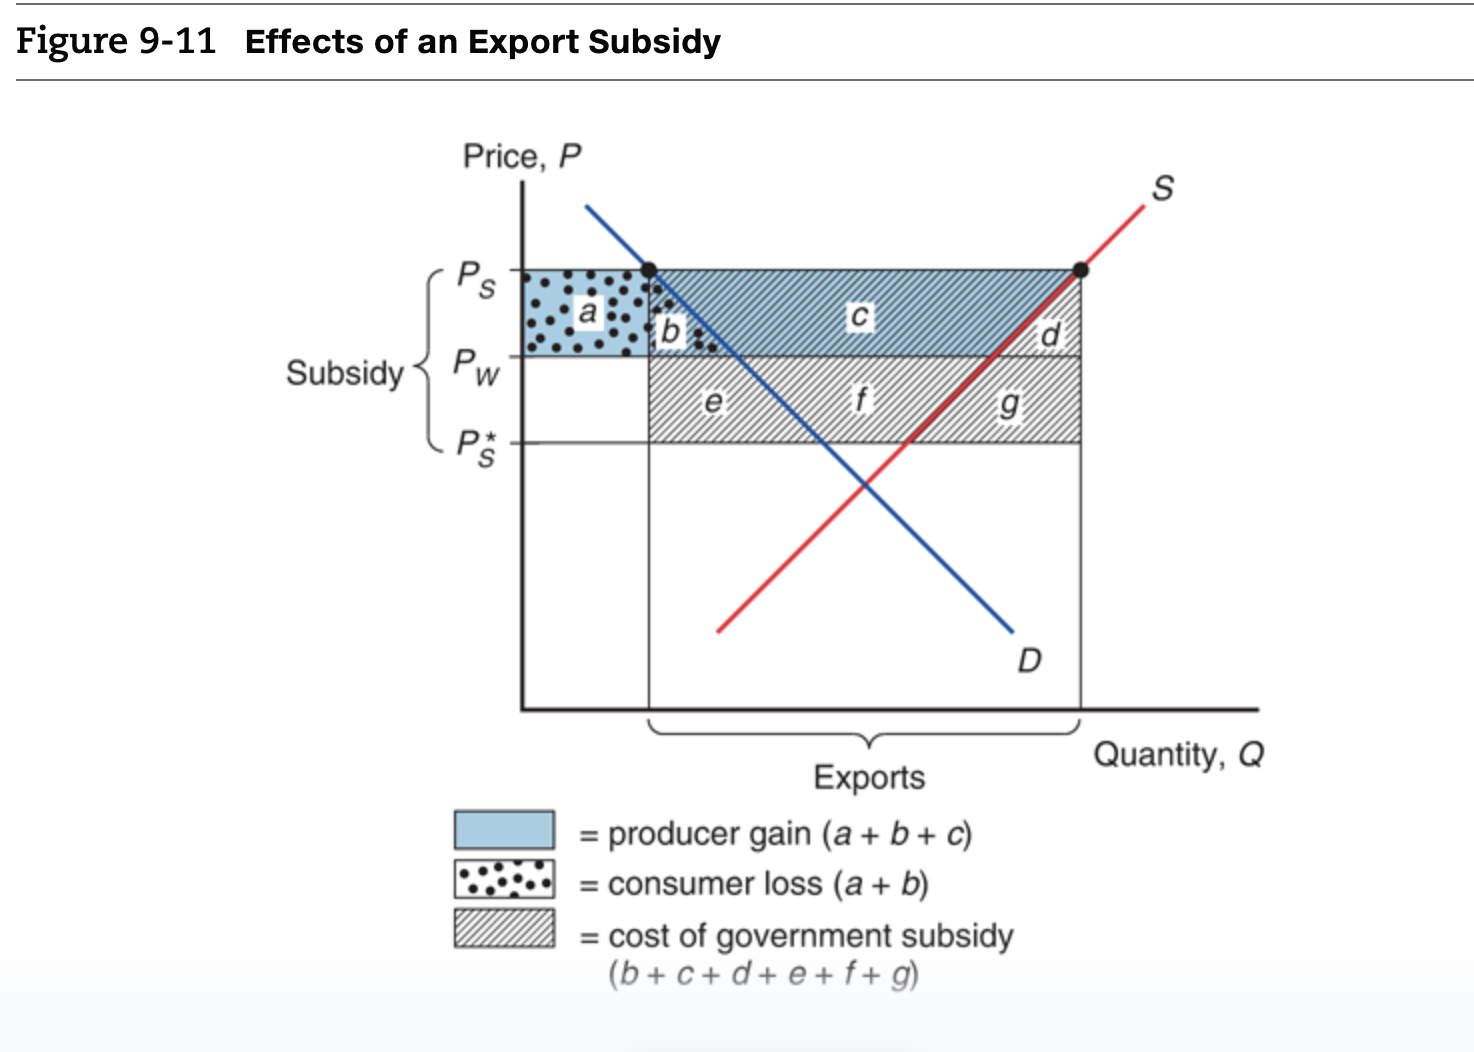
f) Draw a graph of the situation above that is similar to either Figure 9-9 (for a tariff) or Figure 9-11 (for a subsidy). Calculate the consumer and producer gains or losses as well as government revenue or expenditure. Calculate the production and consumption distortions and the terms of trade loss or gain. Use a negative sign to indicate a loss Figure 9-11 Effects of an Export Subsidy Price. P Ps /////////// :7 ./W/ Quantity. 0 Exports = producer gain (a + b + c) = consumer loss (a + b) W = cost of government subsidy (b+ c+d+e+ f+g) EU
Step by Step Solution
There are 3 Steps involved in it
1 Expert Approved Answer
Step: 1 Unlock

Question Has Been Solved by an Expert!
Get step-by-step solutions from verified subject matter experts
Step: 2 Unlock
Step: 3 Unlock