

Question: F E RE 2 D C UU The flowing are the comparative financial statements for Osmo Corporation for 2020 and 2019: 5 OSMO CORPORATION Comparative
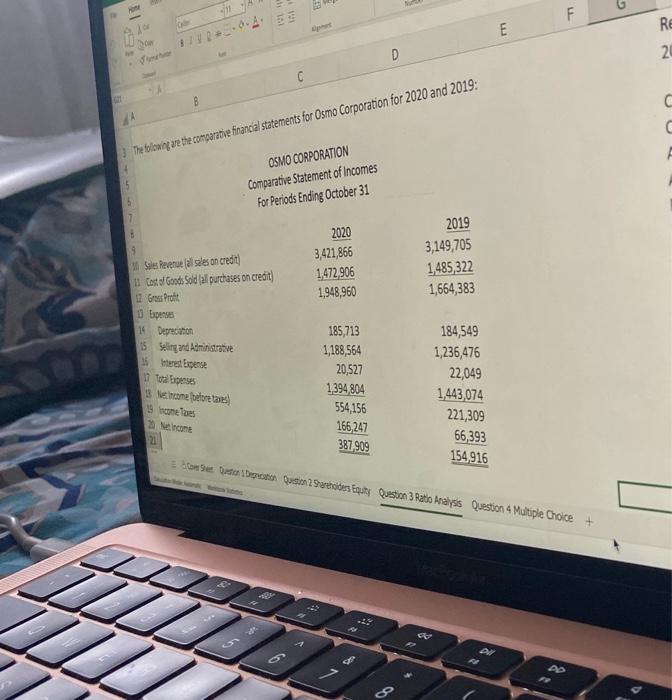
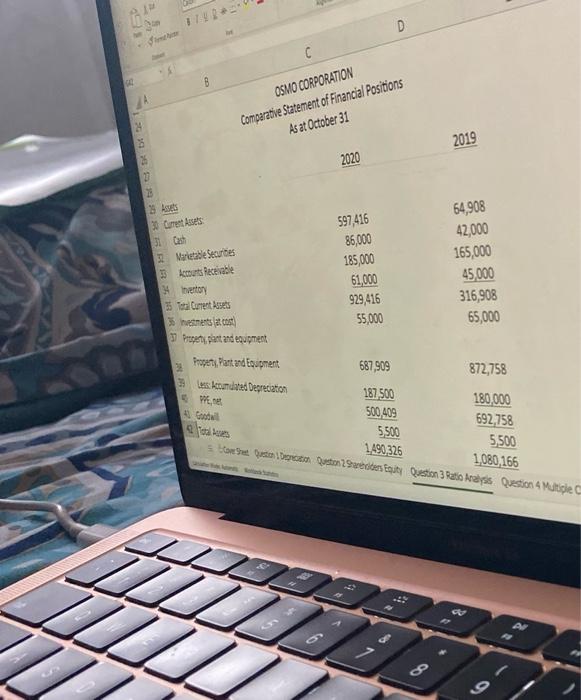
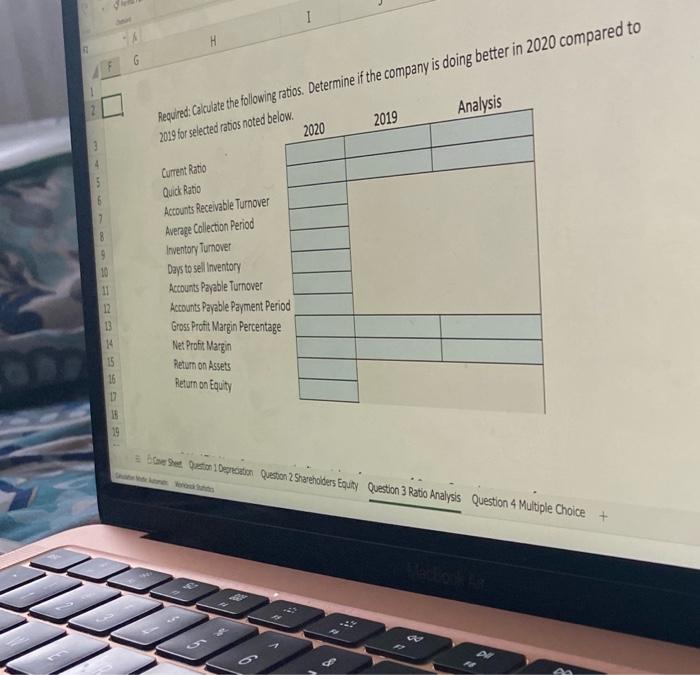

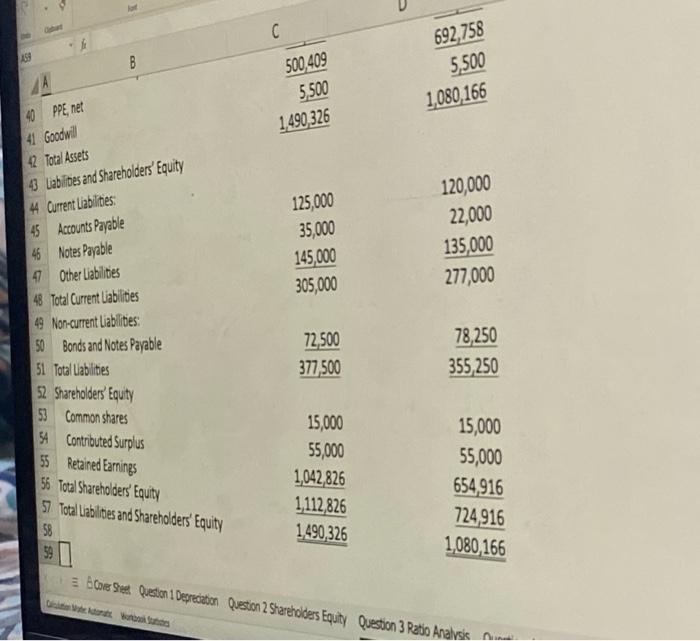
F E RE 2 D C UU The flowing are the comparative financial statements for Osmo Corporation for 2020 and 2019: 5 OSMO CORPORATION Comparative Statement of Incomes For Periods Ending October 31 Sisevere al sales on credit) 11 Case Goods Soldal purchases on credit) 11 Geo Profit 2020 3,421,866 1,472,906 1948,960 2019 3,149,705 1,485,322 1,664,383 Dieses 14 Deprecathlon 15 Seling and Administrative 17 Total penses 3 encome tortas Santos Merone 185,713 1,188,564 20,527 1394 804 554,156 166,247 184,549 1,236,476 22,049 1,443,074 221,309 387 909 66,393 154916 Set die begrotin Questions Equity Question 3 Ratio Analysis Question 4 Multiple Choice + so A 8 D C OSMO CORPORATION Comparative Statement of Financial Positions As at October 31 2 2019 2020 es Martable Securities 597,416 86,000 185,000 61,000 64,908 42,000 165,000 45.000 316,908 65,000 929,416 4 Theory 3 Total Current Assets 36 meses.co 3 Prat and equipment 55,000 2: Property, Pantand Egument 687,909 872,758 21 sented Doctor VE, 187 500 500.409 5500 1.490.326 180,000 692,758 5,500 1,080, 166 Correu Dream Quston Sarees Entity Question Patto kays Question 4 Matice H Required: Calculate the following ratios. Determine if the company is doing better in 2020 compared to 2019 for selected ratios noted below. 2020 2019 Analysis Current Ratio Quick Ratio Accounts Receivable Turnover Average Collection Period 7 8 9 10 11 12 Inventory Turnover Days to sell Inventory Accounts Payable Turnover Accounts Payable Payment Period 14 15 Gross Profit Margin Percentage Net Profit Margin Return on Assets Return on Equity 16 19 s tem 1 ano Question 2 Shareholders Equity Question 3 Ratio Analysis Question 4 Multiple Choice + Cital Thinking Comment on the financial performance of Osmo Corp, in ter 2 liudy db can be contact me C 692,758 199 B A 500,409 5,500 1,490 326 5,500 1,080,166 40 PPE, net 41 Goodwill 42 Total Assets 43 Liabilities and Shareholders Equity 44 Current Liabilities: 125,000 35,000 145,000 305,000 120,000 22,000 135,000 277,000 45 Accounts Payable 46 Notes Payable 47 Other Liabilites 48 Total Current Uabilities 49 Non-current Liablities: 50 Bonds and Notes Payable 51 Total Liabilities 72,500 377,500 78,250 355,250 32 Shareholders Equity 53 common shares 54 Contributed Surplus 55 Retained Earnings 56 Total Shareholders' Equity 57 Total Liabilites and Shareholders' Equity 58 15,000 55,000 1,042,826 1,112,826 1,490,326 15,000 55,000 654,916 724,916 1,080, 166 RES a Borr Street Question 1 Depreciation Question 2 Shareholders Equity Question 3 Ratio Analysis
Step by Step Solution
There are 3 Steps involved in it

Get step-by-step solutions from verified subject matter experts