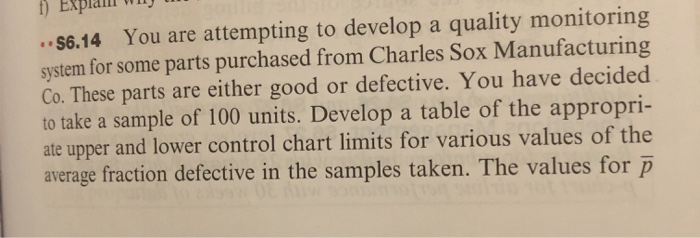
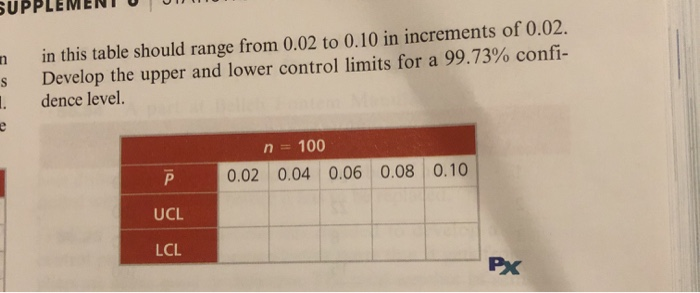
Question: f) Explan Way ..56.14 You are attempting to develop a quality monitoring system for some parts purchased from Charles Sox Manufacturing Co. These parts are

f) Explan Way ..56.14 You are attempting to
f) Explan Way ..56.14 You are attempting to develop a quality monitoring system for some parts purchased from Charles Sox Manufacturing Co. These parts are either good or defective. You have decided to take a sample of 100 units. Develop a table of the appropri- ate upper and lower control chart limits for various values of the average fraction defective in the samples taken. The values for p SUPPLEMENT U UW n in this table should range from 0.02 to 0.10 in increments of 0.02. Develop the upper and lower control limits for a 99.73% confi- dence level. n = 100 0.02 0.04 0.06 0.08 0.10 UCL LCL Px

Step by Step Solution

There are 3 Steps involved in it

1 Expert Approved Answer
Step: 1 Unlock blur-text-image
Question Has Been Solved by an Expert!

Get step-by-step solutions from verified subject matter experts

Step: 2 Unlock
Step: 3 Unlock

Students Have Also Explored These Related General Management Questions!