

Question: explain The contour plot for f(x,y) is shown below. Which of the following are true at the point (-1.4, 0.2) 407 3.60 -4.20 14 0.7

explain
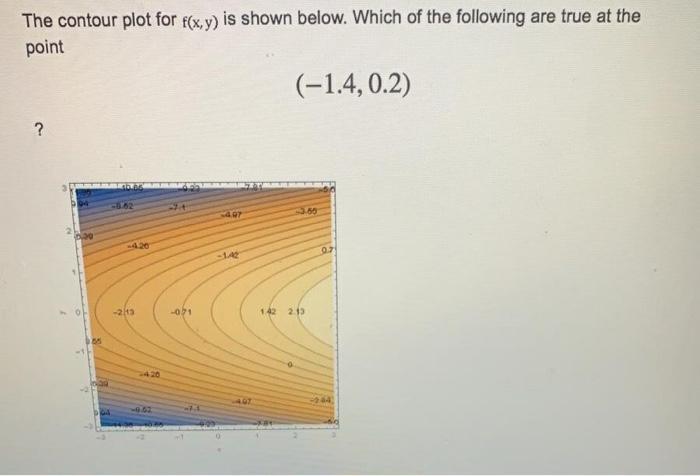
The contour plot for f(x,y) is shown below. Which of the following are true at the point (-1.4, 0.2) 407 3.60 -4.20 14 0.7 -213 -071 1.42 2.13 -420 407 -0.62
Step by Step Solution
★★★★★
3.42 Rating (152 Votes )
There are 3 Steps involved in it
1 Expert Approved Answer
Step: 1 Unlock

Question Has Been Solved by an Expert!
Get step-by-step solutions from verified subject matter experts
Step: 2 Unlock
Step: 3 Unlock