

Question: F (Std No)= 1 Q2. You are expected to prepare and fill a Gantt Chart, given in Figure 2a, in the light of given data
F (Std No)= 1
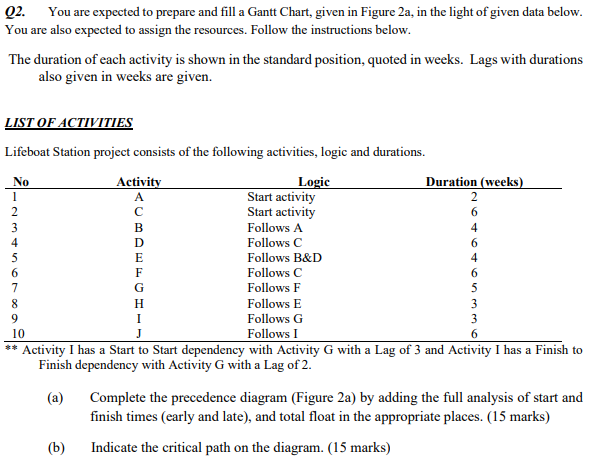
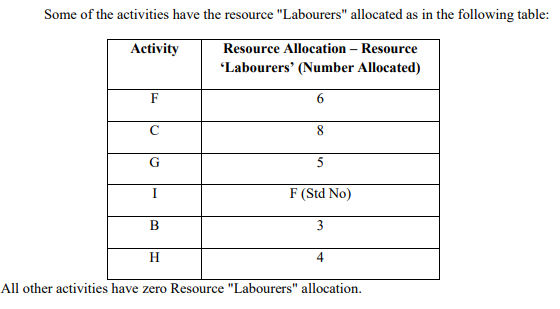
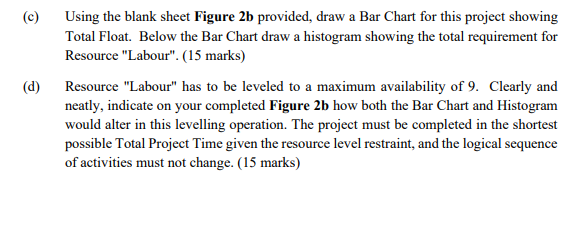
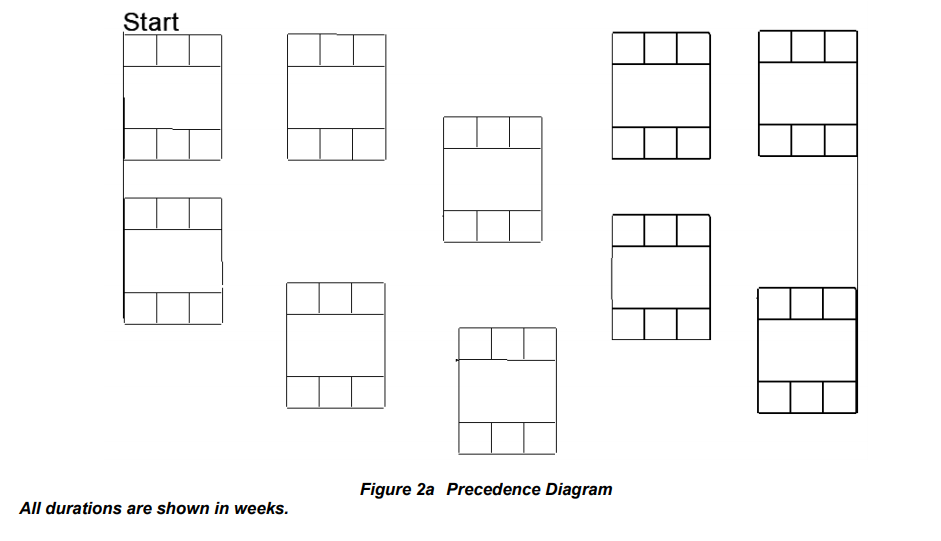
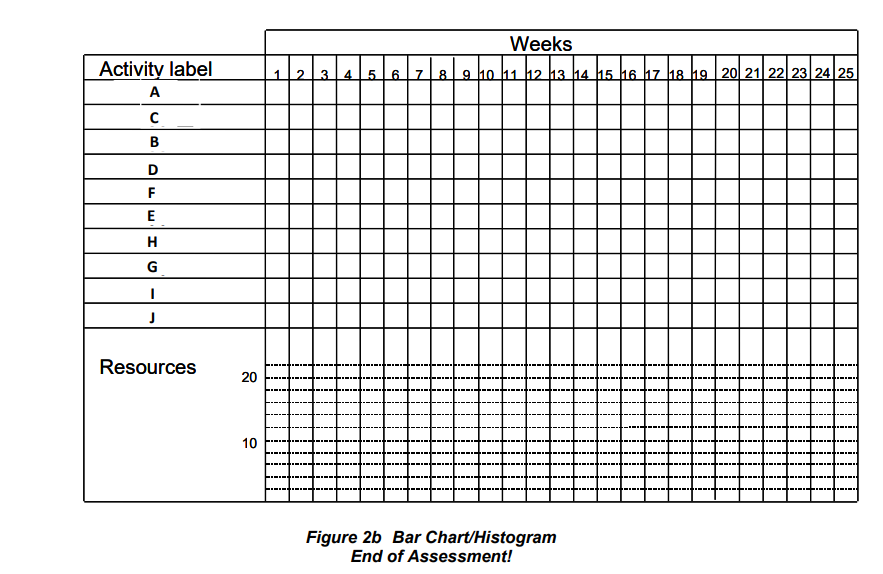
Q2. You are expected to prepare and fill a Gantt Chart, given in Figure 2a, in the light of given data below. You are also expected to assign the resources. Follow the instructions below. The duration of each activity is shown in the standard position, quoted in weeks. Lags with durations also given in weeks are given. No 1 2 3 4 A B 6 4 LIST OF ACTIVITIES Lifeboat Station project consists of the following activities, logic and durations. Activity Logic Duration (weeks) Start activity 2 Start activity Follows A Follows C 5 Follows B&D 4 F Follows C Follows F Follows E 3 9 I Follows G 3 10 J Follows I ** Activity I has a Start to Start dependency with Activity G with a Lag of 3 and Activity I has a Finish to Finish dependency with Activity G with a Lag of 2. (a) Complete the precedence diagram (Figure 2a) by adding the full analysis of start and finish times (early and late), and total float in the appropriate places. (15 marks) (6) Indicate the critical path on the diagram. (15 marks) 6 7 6 5 8 6 Some of the activities have the resource "Labourers" allocated as in the following table: Activity Resource Allocation - Resource 'Labourers' (Number Allocated) F 6 8 G 5 I F (Std No) B 3 H 4 All other activities have zero Resource "Labourers" allocation. C) (d) Using the blank sheet Figure 2b provided, draw a Bar Chart for this project showing Total Float. Below the Bar Chart draw a histogram showing the total requirement for Resource "Labour". (15 marks) Resource "Labour" has to be leveled to a maximum availability of 9. Clearly and neatly, indicate on your completed Figure 2b how both the Bar Chart and Histogram would alter in this levelling operation. The project must be completed in the shortest possible Total Project Time given the resource level restraint, and the logical sequence of activities must not change. (15 marks) Start Figure 2a Precedence Diagram All durations are shown in weeks. Weeks Activity label A 112131415161718 9 10 11 12 13 14 15 16 17 18 19 20 21 22 23 24 25 C B D F E H 1 J Resources 20 10 DIE II. DIIDID Figure 2b Bar Chart/Histogram End of AssessmentStep by Step Solution
There are 3 Steps involved in it
1 Expert Approved Answer
Step: 1 Unlock

Question Has Been Solved by an Expert!
Get step-by-step solutions from verified subject matter experts
Step: 2 Unlock
Step: 3 Unlock