

Question: F test And T Test please!!! Don't use other answers posted here! make sure to state which one is faster. Assigned: You and some of
F test And T Test please!!! Don't use other answers posted here! make sure to state which one is faster.
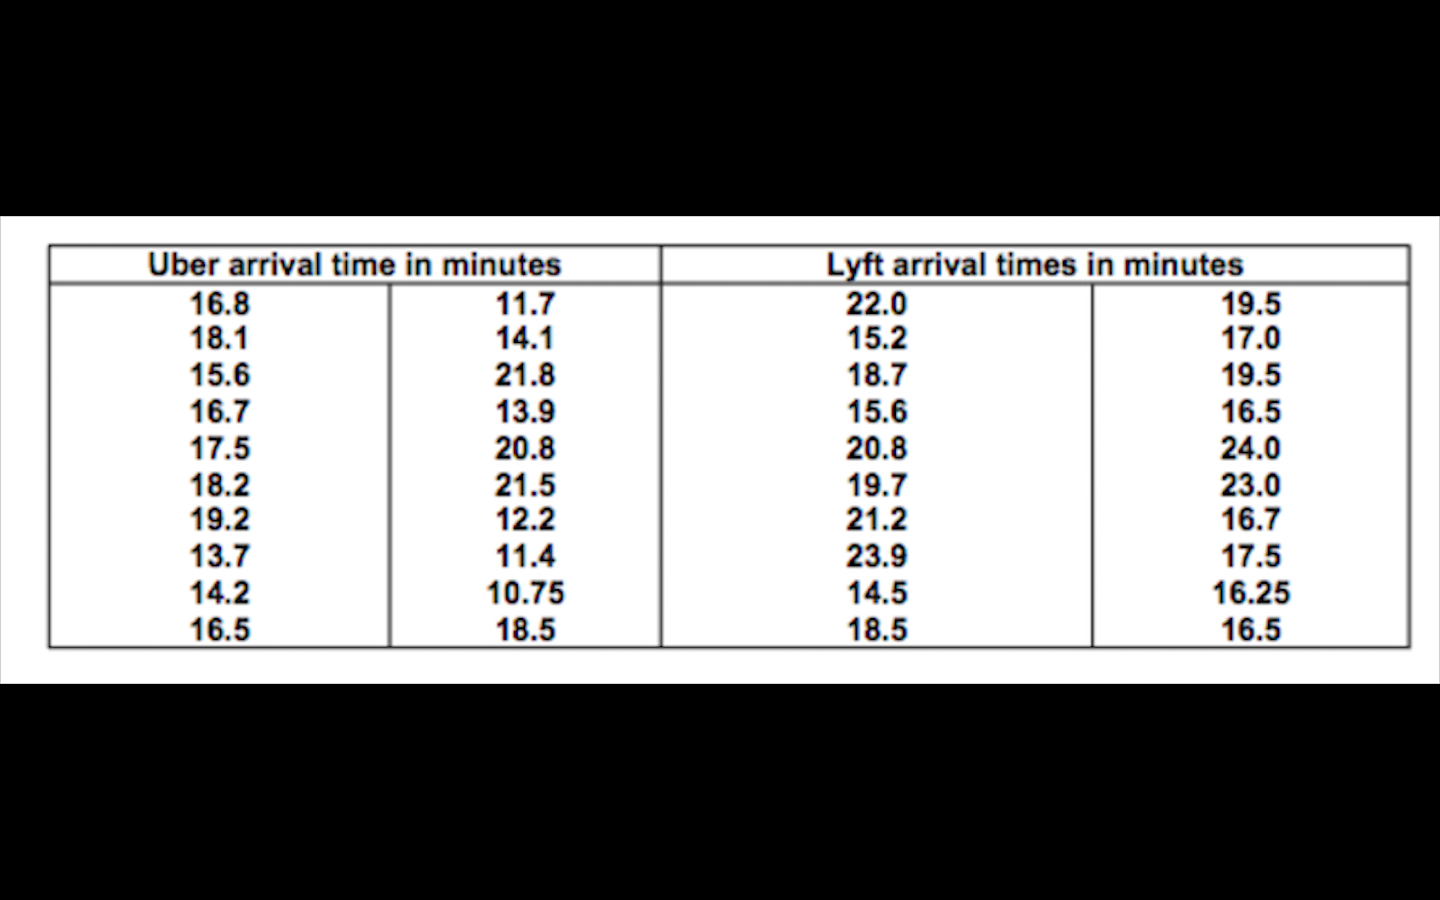
Assigned: You and some of your friends have decided to determine which ride service arrives faster to pick you up at your residence. Both Uber and Lyft are tested. The variable of interest is arrival time in minutes from the time you submit your ride request. You collect the data ordering 20 rides from Uber and 20 from Lyft at varying times. The following table is the record of the arrival times:
At the .10 level of significance/ confidence level of 0.90 , is there sufficient evidence that the mean arrival time for Uber differs from the mean arrival time of Lyft?
Complete testing in Minitab and prepare report in Word. Enter the data presented above into a Minitab worksheet. Conduct the test with alpha of .10 and complete the following.
Using the six-step process for each hypothesis test complete the following for the ride arrival time analysis.
F test:
Set up the six-step process and using a folded test.
In your conclusion include only the critical value/critical ratio and p value techniques. Present the Minitab output in your conclusion.
For your interpretation discuss whether the distributions have equal variances. Do not include graphs from the F test. Interpretation: State whether the variances are significantly different and which type of T test you will undertake given the outcome of the f test you just completed.
T test:
Determine whether to use Case 2 or Case 3 t- test. Set up the six-step process your selected technique.
In your conclusion present the output from Minitab for:
Critical value/critical ratio technique
pvalue
Confidence intervals.
Based on the characteristics of each of the above techniques include statements regarding Fail to reject or rejection of the null and type of error which may have been made.
Interpretation: Determine which (if either) of the services is faster and identify the faster of the two. Discuss the meaning of the confidence interval as part of your interpretation.
Assumption Section: Use boxplot to satisfy assumption of normality as sample size is
6 Step:
Name:
Chapter:
Problem Definition:
Hypothesis
Decision Rule:
Test:
Conclusion:
Interpretation:
Assumptions:
Thank you!!
\begin{tabular}{|c|c|c|c|} \hline \multicolumn{2}{|c|}{ Uber arrival time in minutes } & \multicolumn{2}{|c|}{ Lyft arrival times in minutes } \\ \hline 16.8 & 11.7 & 22.0 & 19.5 \\ 18.1 & 14.1 & 15.2 & 17.0 \\ 15.6 & 21.8 & 18.7 & 19.5 \\ 16.7 & 13.9 & 15.6 & 16.5 \\ 17.5 & 20.8 & 20.8 & 24.0 \\ 18.2 & 21.5 & 19.7 & 23.0 \\ 19.2 & 12.2 & 21.2 & 16.7 \\ 13.7 & 11.4 & 23.9 & 17.5 \\ 14.2 & 10.75 & 14.5 & 16.25 \\ 16.5 & 18.5 & 18.5 & 16.5 \\ \hline \end{tabular}
Step by Step Solution
There are 3 Steps involved in it

Get step-by-step solutions from verified subject matter experts