Question: (F) What happens when the standard deviation is really close to zero ? (G) What happens when the time to maturity is really close to
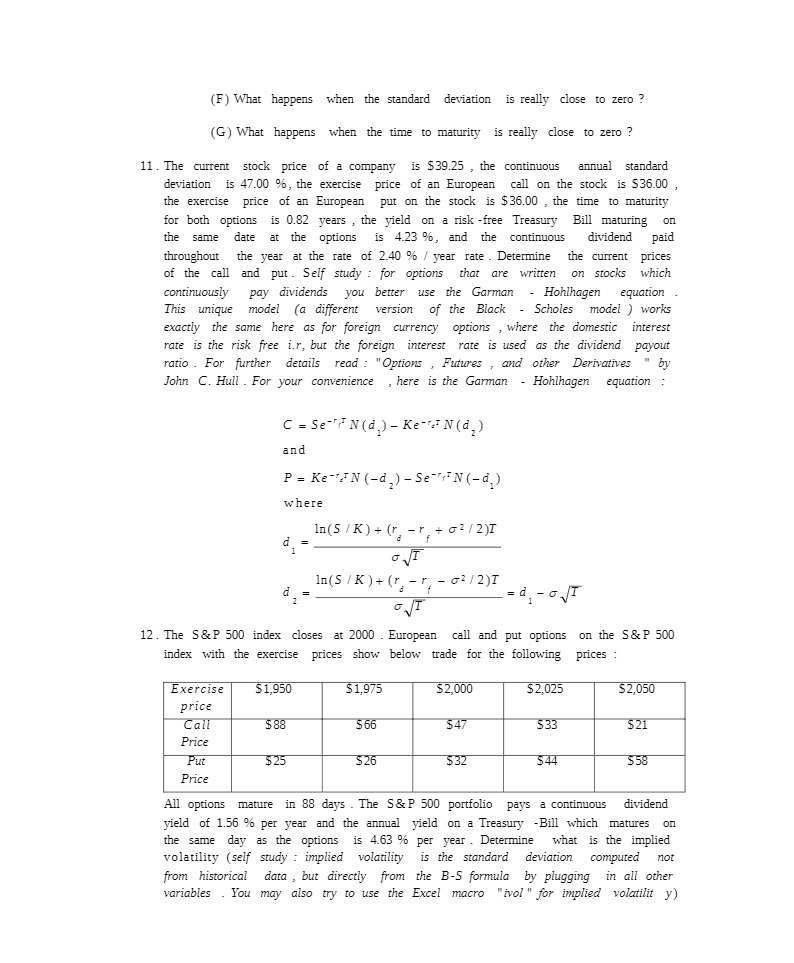
(F) What happens when the standard deviation is really close to zero ? (G) What happens when the time to maturity is really close to zero ? 11. The current stock price of a company is $39.25 , the continuous annual standard deviation is 47.00 9%, the exercise price of an European call on the stock is $36.00 the exercise price of an European put on the stock is $36.00 , the time to maturity for both options is 0.82 years , the yield on a risk -free Treasury Bill maturing on the same date at the options is 4.23 9%, and the continuous dividend paid throughout the year at the rate of 2.40 96 / year rate . Determine the current prices of the call and put . Self study : for options that are written on stocks which continuously pay dividends you better use the Garman - Hohlhagen equation This unique model (a different version of the Black - Scholes model ) works exactly the same here as for foreign currency options , where the domestic interest rate is the risk free i.r, but the foreign interest rate is used as the dividend payout ratio . For further details read : "Options , Futures , and other Derivatives " by John C. Hull . For your convenience , here is the Garman - Hohlhagen equation C = Se"/N (d,) - Ke-& N(d,) and P = Ke-:N (-d,) - Se",N(-d.) where In (5 / K) + (r -r, + 62 / 2)I .= In(5 / K ) + (r - r, - G: /2)I d = d - o /I 12. The S&P 500 index closes at 2000 . European call and put options on the S&P 500 index with the exercise prices show below trade for the following prices : Exercise $1,950 $1,975 $2,000 $2,025 $2,050 price Call $ 88 $ 66 $47 $33 $21 Price Put $25 $26 $32 $44 $58 Price All options mature in 88 days . The S&P 500 portfolio pays a continuous dividend yield of 1.56 6 per year and the annual yield on a Treasury -Bill which matures on the same day as the options is 4.63 96 per year . Determine what is the implied volatility (self study : implied volatility is the standard deviation computed not from historical data , but directly from the B-S formula by plugging in all other variables . You may also try to use the Excel macro "ivol " for implied volatilit y)