

Question: f. Which graphic below (A or B) shows the correct way to use the Delta T time intervals to determine the distance to the earthquake??
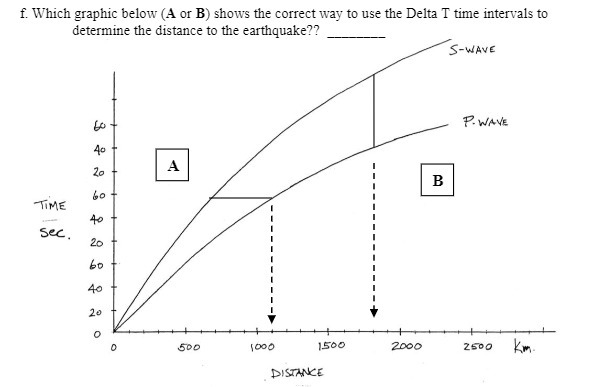
f. Which graphic below (A or B) shows the correct way to use the Delta T time intervals to determine the distance to the earthquake?? S-WAVE P. WAVE 40 A B -TIME 40 Sec. 20 60 40 20 O 1000 1500 2000 2500 Km- DISTANCE
Step by Step Solution
There are 3 Steps involved in it
1 Expert Approved Answer
Step: 1 Unlock

Question Has Been Solved by an Expert!
Get step-by-step solutions from verified subject matter experts
Step: 2 Unlock
Step: 3 Unlock