

Question: f1. Create a contingency table using Carrier and Origin as your columns and rows, respectively. 2. What is the null hypothesis for a test of
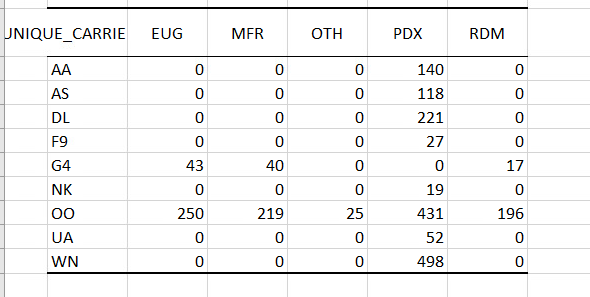
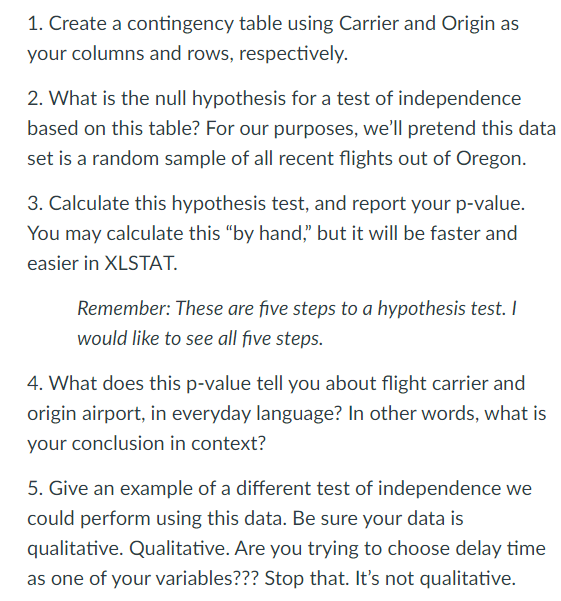
\f1. Create a contingency table using Carrier and Origin as your columns and rows, respectively. 2. What is the null hypothesis for a test of independence based on this table? For our purposes, we'll pretend this data set is a random sample of all recent ights out of Oregon. 3. Calculate this hypothesis test, and report your p-value. You may calculate this \"by hand." but it will be faster and easier in XLSTAT. Remember: These are ve steps to a hypothesis test. l would like to see all five steps. 4. What does this p-value tell you about ight carrier and origin airport, in everyday language? In other words, what is your conclusion in context? 5. Give an example of a different test of independence we could perform using this data. Be sure your data is qualitative. Qualitative. Are you trying to choose delay time as one of your variables??? Stop that. It's not qualitative
Step by Step Solution
There are 3 Steps involved in it

Get step-by-step solutions from verified subject matter experts