

Question: f11. Create a new code chunk and use the pairs function to create scatter plots for numeric variables only in the baseball data set: pairs(Filter(is.numeric,baseball))
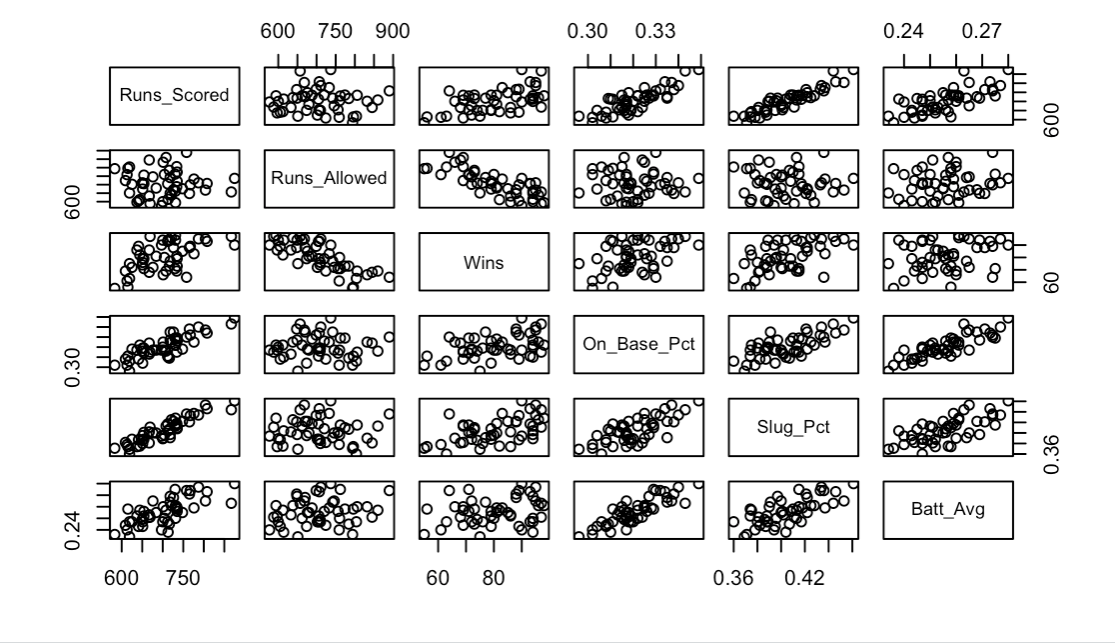
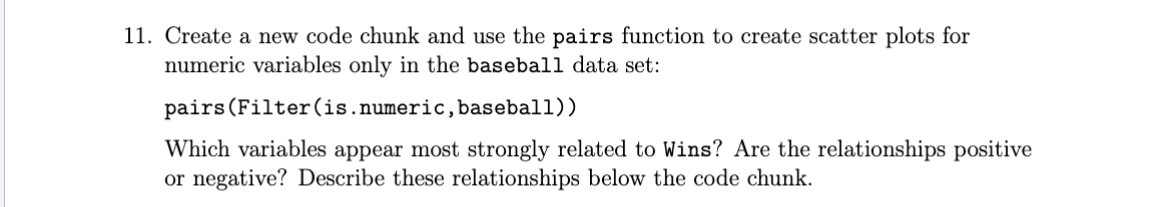
\f11. Create a new code chunk and use the pairs function to create scatter plots for numeric variables only in the baseball data set: pairs(Filter(is.numeric,baseball)) Which variables appear most strongly related to Wins? Are the relationships positive or negative? Describe these relationships below the code chunk
Step by Step Solution
There are 3 Steps involved in it
1 Expert Approved Answer
Step: 1 Unlock

Question Has Been Solved by an Expert!
Get step-by-step solutions from verified subject matter experts
Step: 2 Unlock
Step: 3 Unlock