

Question: f11. From Table 3, how much variability in Phyfu does BMI account for? a. -38% b. 14% C. 62% d. 38% 12. From Table 3,


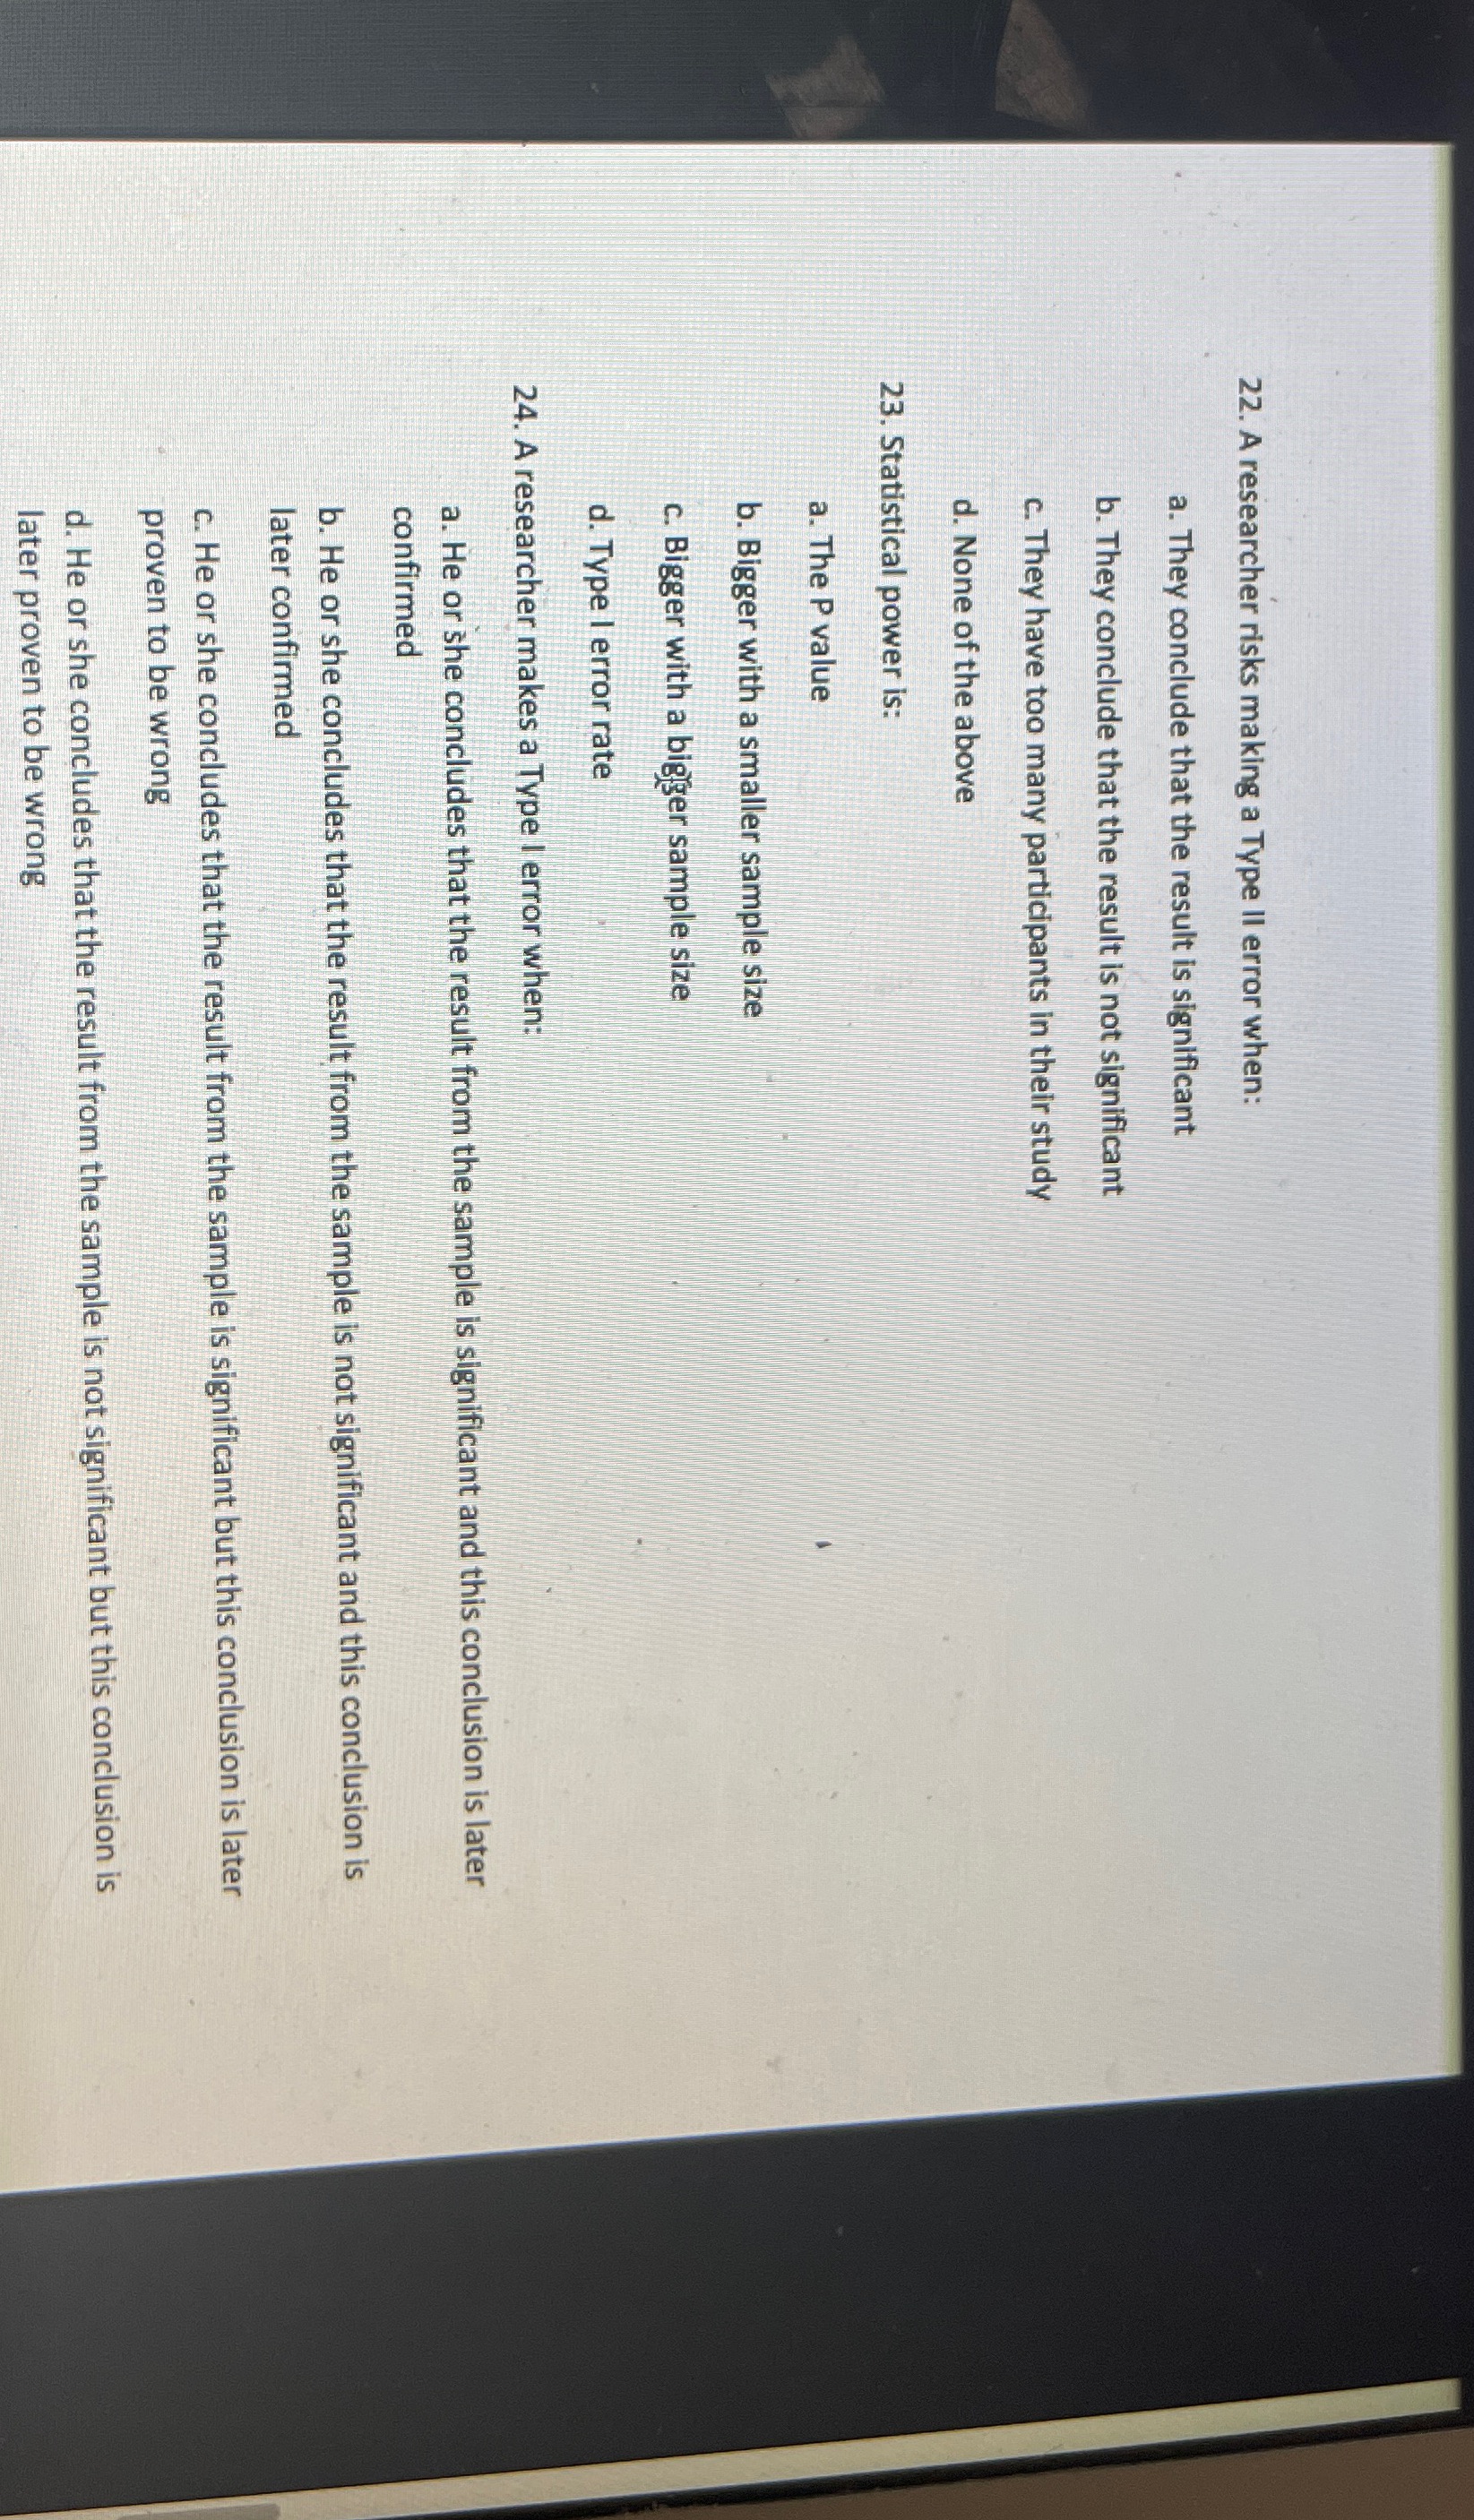


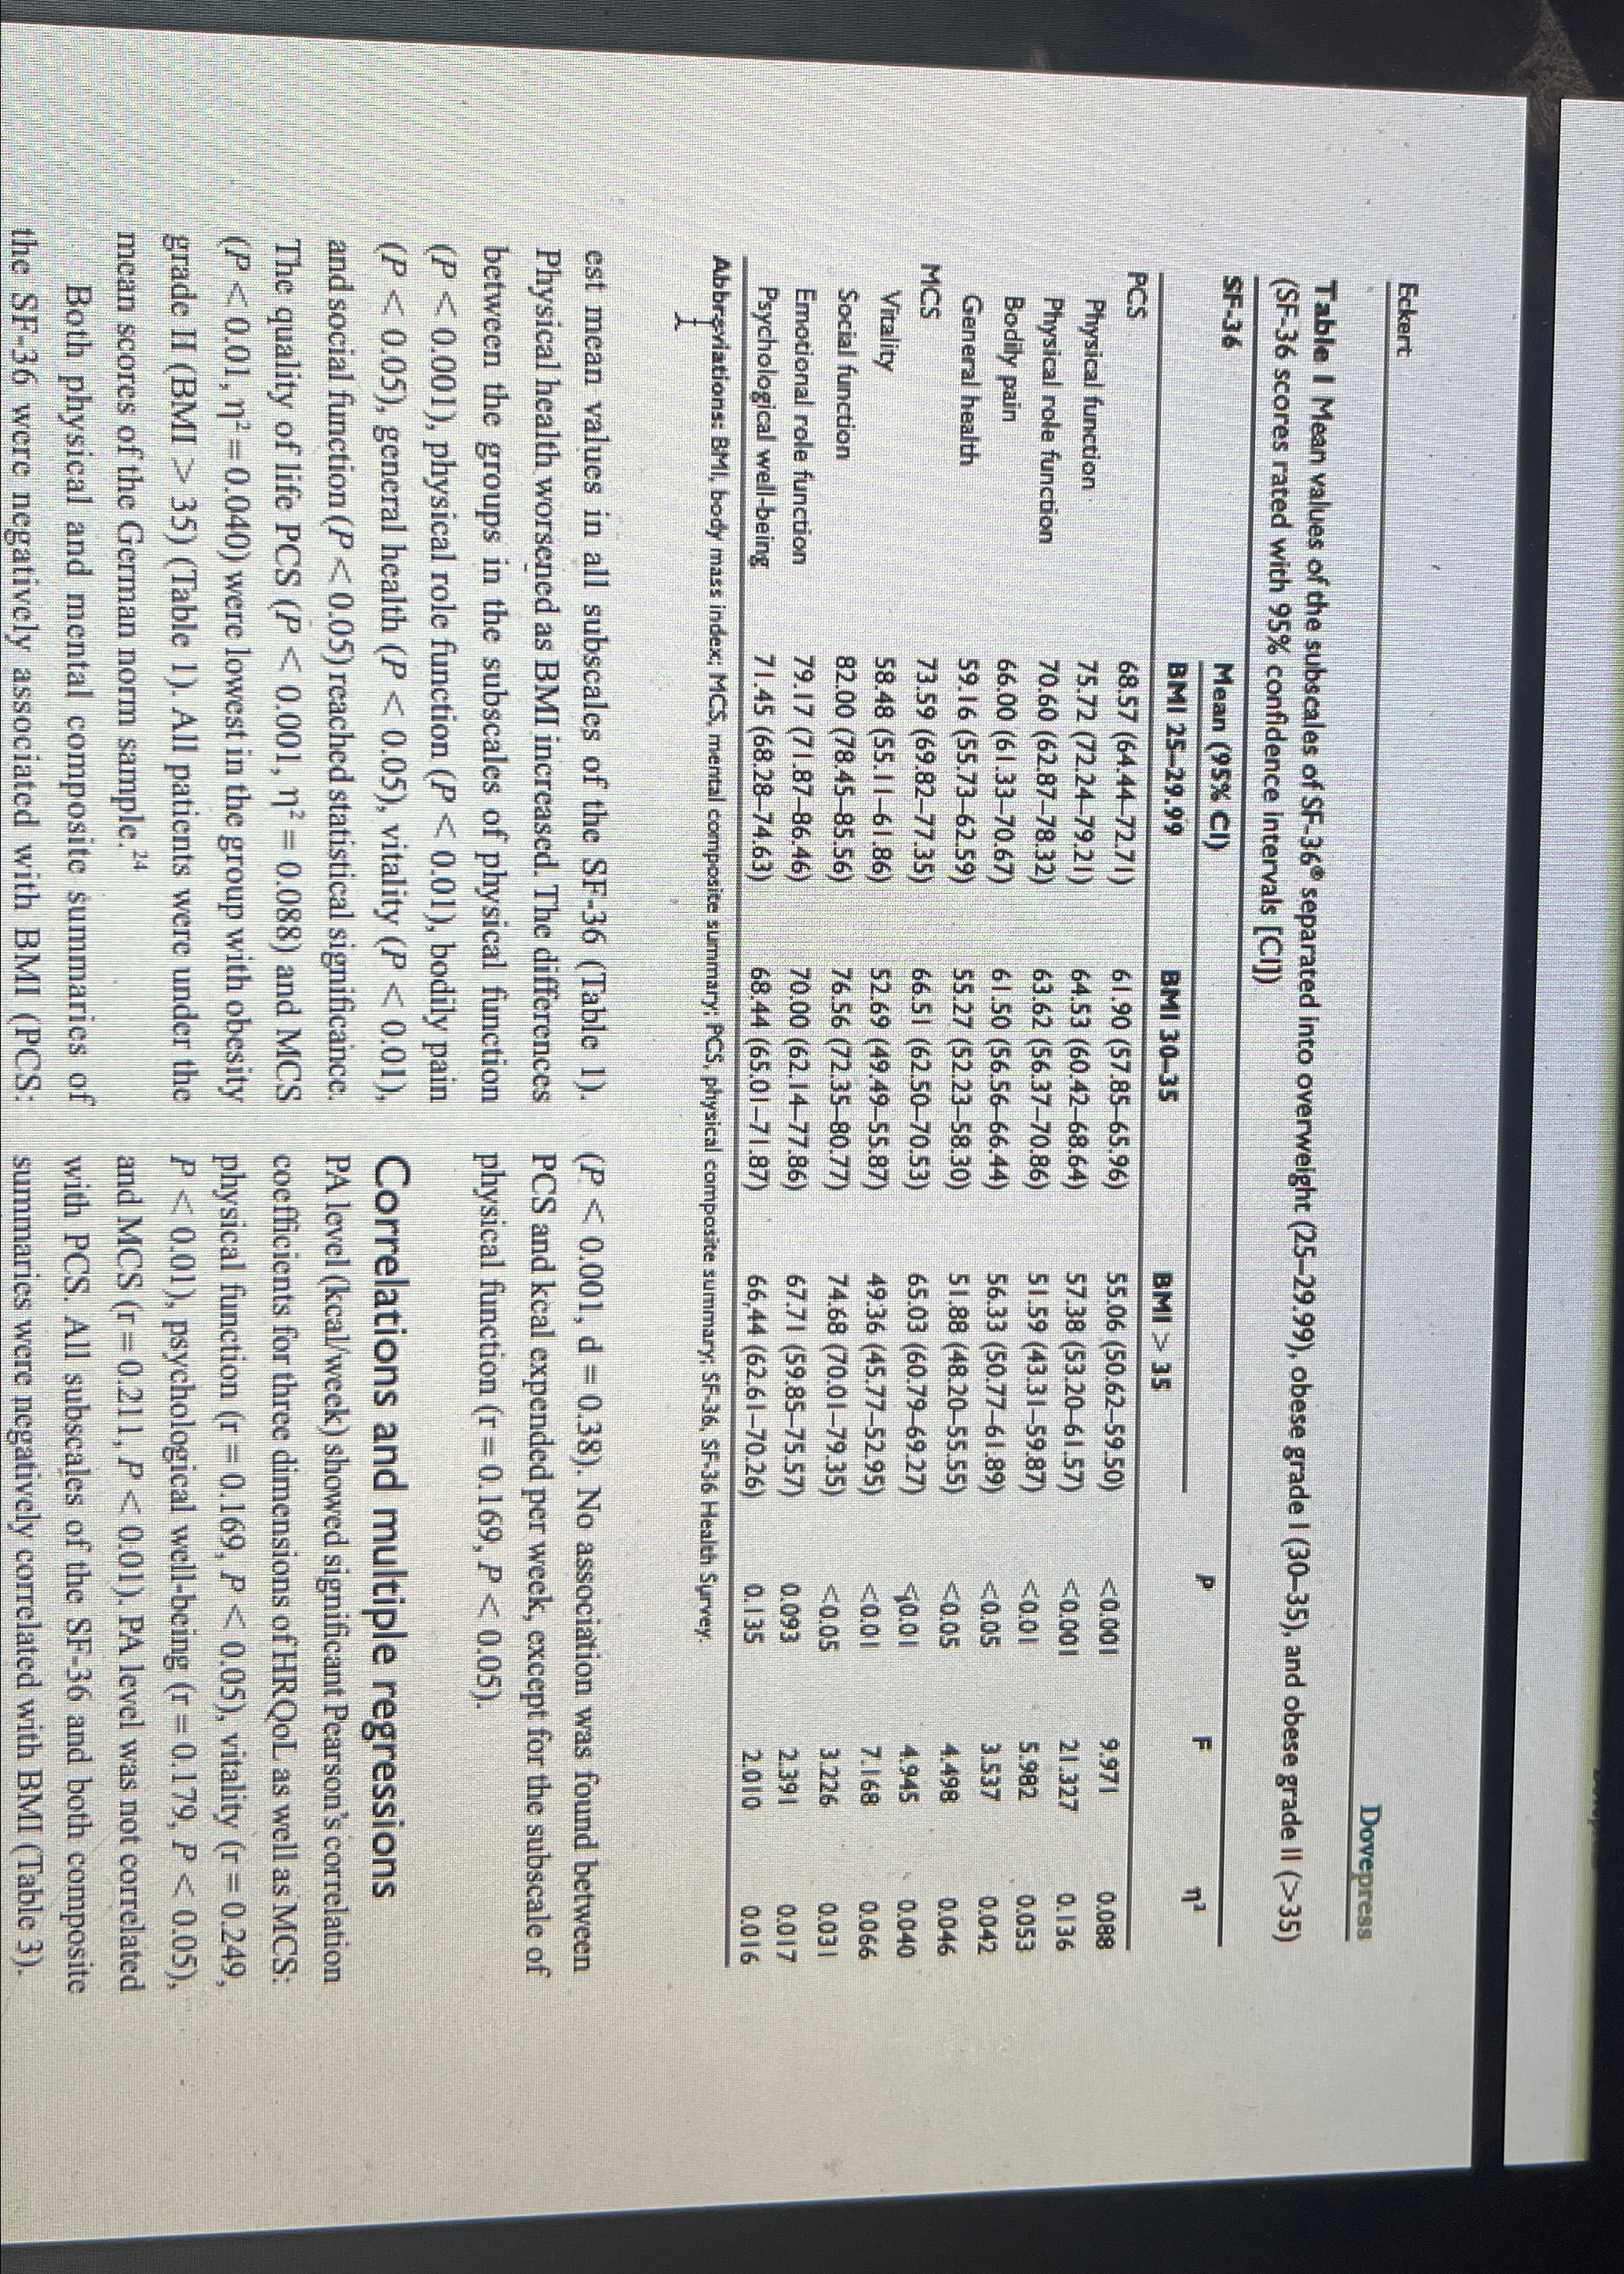


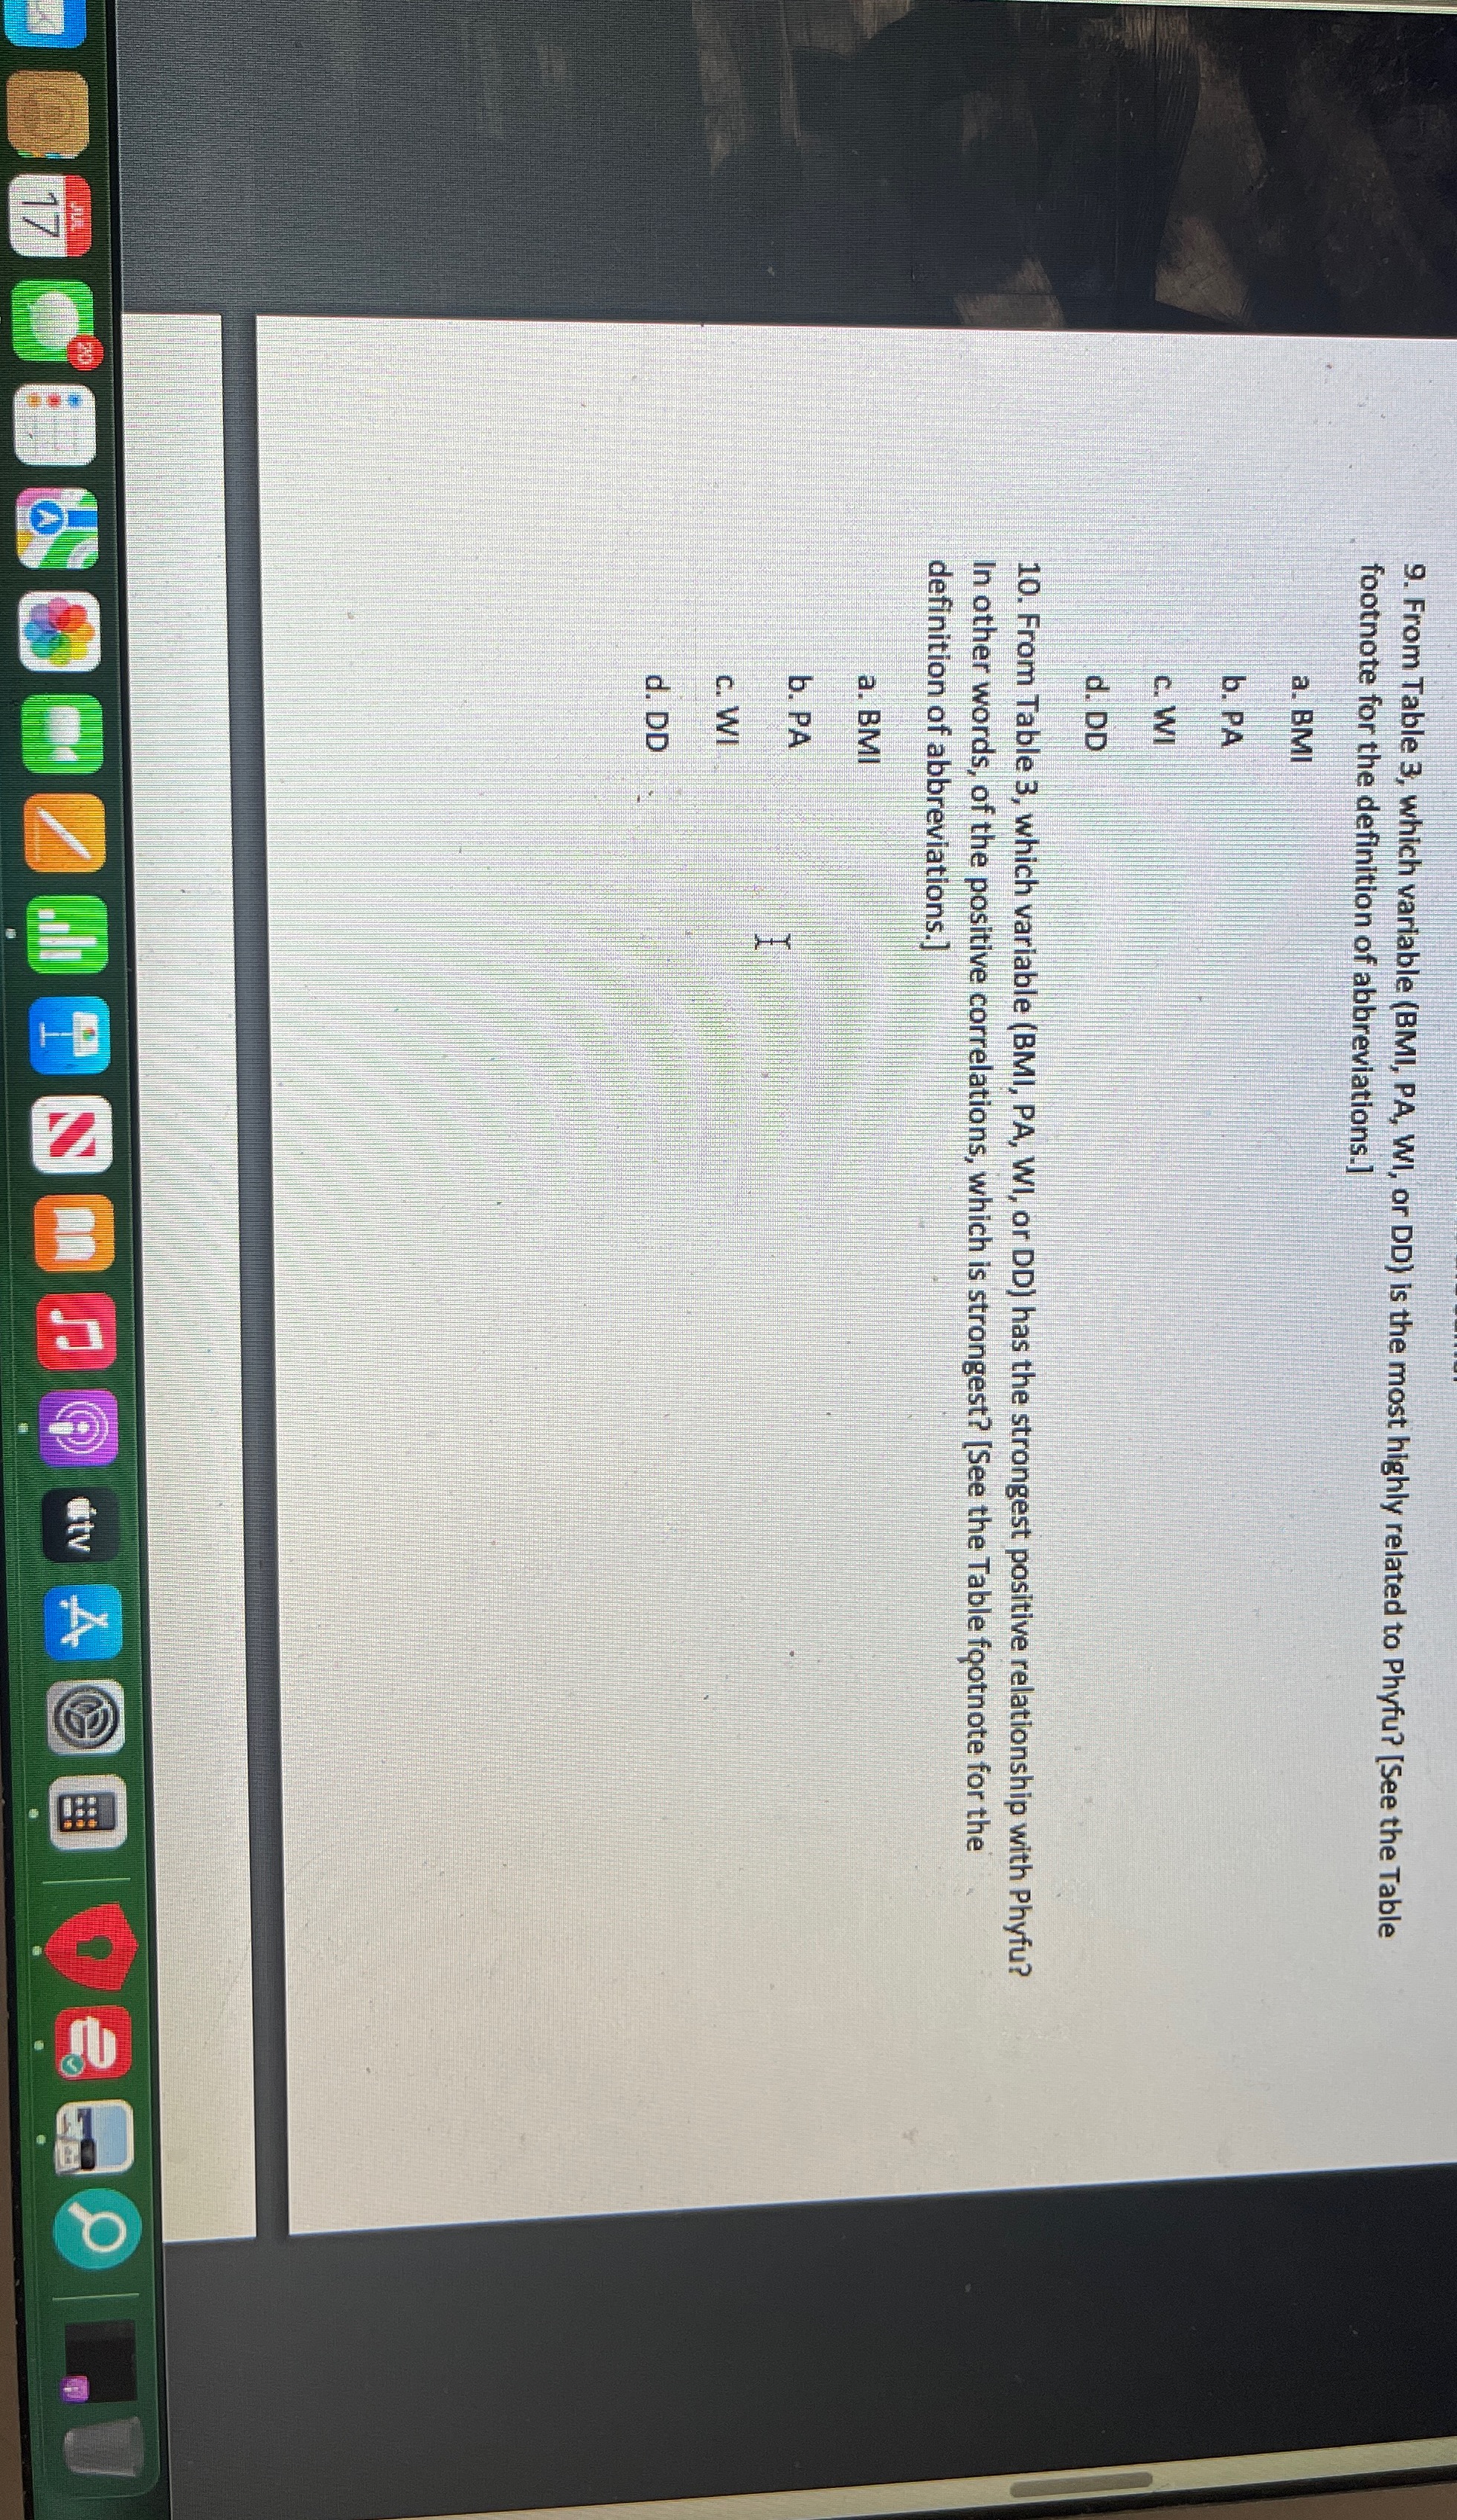
\f11. From Table 3, how much variability in Phyfu does BMI account for? a. -38% b. 14% C. 62% d. 38% 12. From Table 3, the r for PA and age was -0.252 and was statistically significant. What does this mean? a. Older people tended to be more active b. Older people tended to be less active c. Age and physical activity were not related 13. From Table 3, the r for BMI and WI was -0.090 and was not statistically significant. What does this mean? a. Those with a high BMI tended to have a high WI score b. Those with a high BMI tended to have a low WI score c. BMI and WI were not related 14. From Table 4, which of the following is a y variable? a. Vitality b. Age c. Sex d. BMI C 0 ?0 di tv 4.22. A researcher risks making a Type II error when: a. They conclude that the result is significant b. They conclude that the result is not significant c. They have too many participants in their study d. None of the above 23. Statistical power is: a. The P value b. Bigger with a smaller sample size c. Bigger with a bigger sample size d. Type | error rate 24. A researcher makes a Type I error when: a. He or she concludes that the result from the sample is significant and this conclusion is later confirmed b. He or she concludes that the result from the sample is not significant and this conclusion is later confirmed c. He or she concludes that the result from the sample is significant but this conclusion is later proven to be wrong d. He or she concludes that the result from the sample is not significant but this conclusion is later proven to be wrong6. If you were told that the median for age was 50 years and the mean was 63.2 years, what would this distribution look like? a. A platykurtic curve b. A normally distributed curve c. A negatively skewed curve d. A positively skewed curve 7. Find the variable "average duration of known type 2 diabetes" in the Results section. How likely is it that a person would have been a diabetic for 42 years? a. Very likely since this number is well within plus or minus 1 SD of the mean. b. Unlikely since this number is well within plus or minus 1 SD of the mean. c. Very likely since this number is well outside of plus or minus 3 SD of the mean. d. Unlikely since this number is well outside plus or minus 3 SD of the mean. 8. From the Results section, third paragraph, for whom was age more scattered (or more spread out)? a. Those participants with a BMI of 25-30 b. Those participants with a BMI of > 35 c. The variability of their distributions was the same. 9. From Table 3, which variable (BMI, PA, WI, or DD) is the most highly related to Phyfu? [See the Table footnote for the definition of abbreviations.] a. BMI b. PA c. WI 4. 94. From the Results section, the range for age was: a. 36 years b. 40 years c. 63 years d. 76 years 5. From the Results section, the 7.6 year SD for age means: a. Body weight is 7.6% variable. b. The middle 68% of the scores fall between 55.6 years and 70.8 years. c. The middle 95% of the scores fall between 48.0 years and 78.4 years. d. Both b and c. 6. If you were told that the median for age was 50 years and the mean was 63.2 years, what would this distribution look like? a. A platykurtic curveEckert Dovepress Table I Mean values of the subscales of SF-36" separated into overweight (25-29.99), obese grade I (30-35), and obese grade II (>35) (SF-36 scores rated with 95% confidence intervals [CI]) SF-36 Mean (95% CI) BMI 25-29.99 BMI 30-35 BMI > 35 PCS 68.57 (64.44-72.71) 61.90 (57.85-65.96) 55.06 (50.62-59.50) 35) (Table 1). All patients were under the P
Step by Step Solution
There are 3 Steps involved in it

Get step-by-step solutions from verified subject matter experts